Trending and the MACD
November 1, 2019As stats junkies, we’re naturally drawn to season averages. By comparing season averages, we gain context into what areas a team does well and what areas are deficient. As the number of games in the season increases, we obtain a better estimate of the mean but at the cost of losing sensitivity to localized effects. For instance, if a team loses their star player to injury for a stretch of 6 games, a more localized mean estimate might be more useful than the season mean.
A running moving average is a much more flexible model that reduces the bias of the season-wide mean estimate at the cost of higher variance. However, a moving average fails to provide any context to the measured metric. For instance, both Duke and Chicago State could be 3-7 over their last 10 games, and would both sport a 0.3 winning percentage. But the context of these numbers is missing. For Duke, a 3-7 record would probably be considered an unmitigated disaster. For Chicago State, who went 3-29 in 2018-19, 3 wins in 10 games might be considered a bit of a hot streak. How then, can these two winning percentages be differentiated?
The MACD is a trend indicator that gives context to a short term moving average by comparing it to a longer term moving average. The MACD is known mostly for its applications in securities analysis but there are no parameters specific to finance – just a simple difference of moving averages. Although some technical analysts use the MACD as an indicator for future movement, we’re using it here strictly as measure of established and past trend, as it is a lagging indicator.
The MACD is defined as the long-term moving average subtracted from the short-term moving average. The MACD uses exponential moving averages, EMAs, which, while similar to simple moving averages, differ in that greater weight is placed on more recent data. A positive MACD indicates an uptrend – the short-term average is greater than the long-term average. Similarly, a negative MACD indicates a downtrend. The magnitude of the difference describes the strength of the trend. The most common parameterization of the MACD is a 12-period EMA for the short-term moving average and a 26-period EMA for the long-term moving average.
The 9-period EMA of the MACD is called the Signal Line. Similar to the MACD itself, the MACD is then subtracted from the MACD Signal Line. A positive value indicates that the MACD is above it’s own moving average – which indicates the MACD itself is in a positive trend. Similarly, a negative value indicates the MACD is trending down.
The MACD and Signal Line are usually plotted on a separate graph, directly beneath the metric being measured, along with the corresponding EMAs:
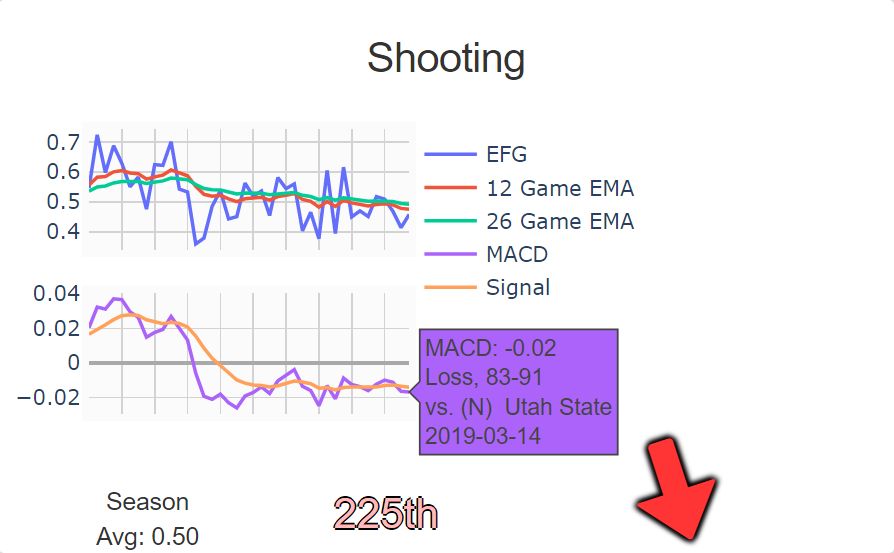
The angle and color of the arrow correspond to the magnitude and sign of the MACD, enabling the ability to quickly assess the current trends of a team’s offense and defense. This is an example “cockpit view” of a team’s offense:
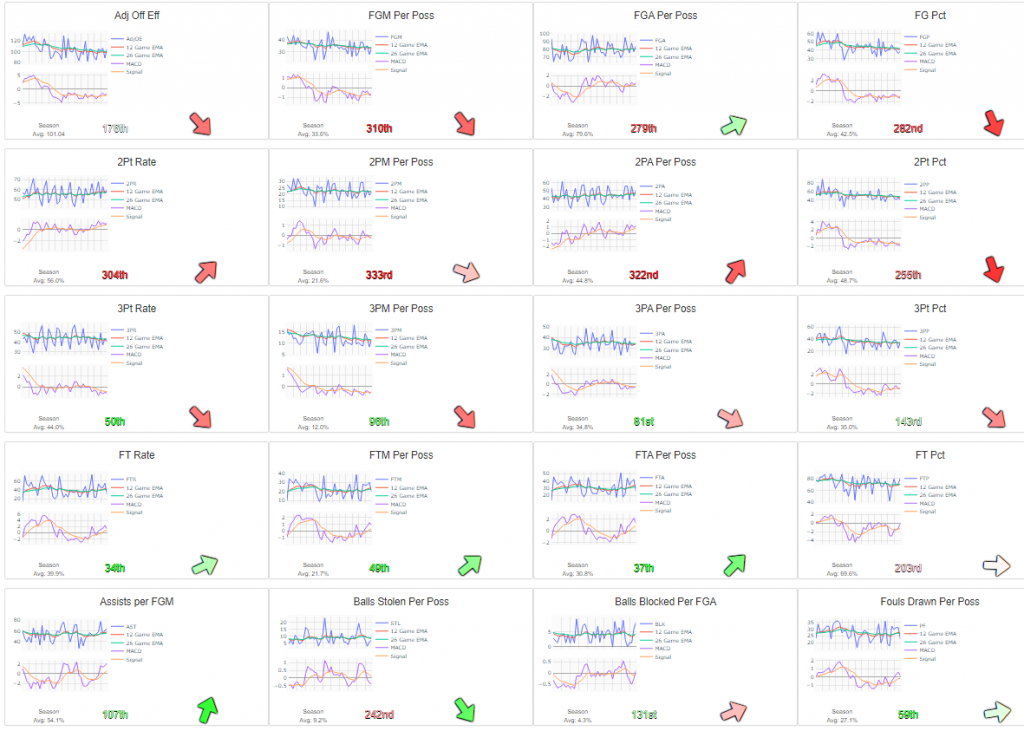
The Offense and Defense Cockpit views are available in each team’s dashboard, with further MACD trending info available for conference data and overall D1 statistics.