Offense and Defense Labs
November 3, 2019IMPORTANT: As with the Trend Labs, the Offense and Defense Labs can be very computationally and memory intensive! An up-to-date browser and recent hardware is required. If you’re running a Mosaic emulator on your Commodore 64, you’re going to want to avoid these tools.
The Offense and Defense Labs integrate box score data, play-by-play data, and shot chart data, in an interactive tool that enables users to select situational stats to explore. Each tool has the same structure: a row for selection controls (Season selector and Statistic to show), a Game Select section, a Game Clock section, a Game Flow section, a Shot Clock section, a Shot Chart section, and a Player Stats section.
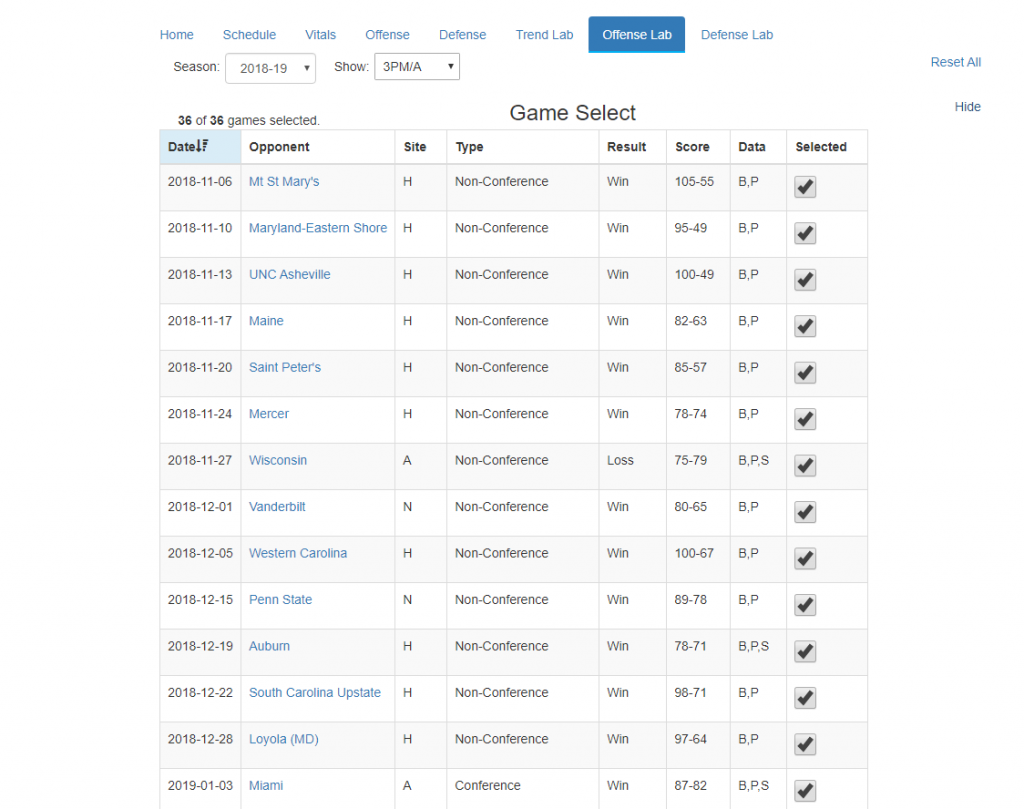
The Game Select section is by default hidden and all games of the selected season are selected. To select a subset of the games, expand the Game Select section by click on ‘Show’. Games for which there is a minimum of boxscore data will be selected. Clicking on the ‘Selected’ column will select/deselect games for this tool. The available data is listed in the ‘Data’ column: B for Boxscore data, P for Play-by-Play data, and S for shotchart data. The play-by-play data contributes to the Game Clock chart, the Game Flow charts, the Shot Clock chart, and the Player Stats charts. The shotchart data contributes to the Shot Chart section only so missing shotchart data will not affect the other chart sections.
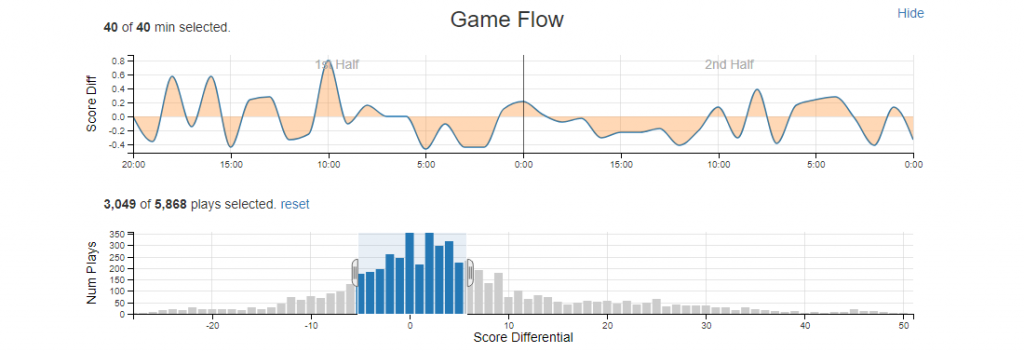
The Game Clock and Game Flow sections display and allow selection of different segments of each selected game. The games are binned into forty bins, each bin representing a minute (for overtime games, each 5 minute overtime period overlaid on the last 5 minutes of the game chart). The Game Clock chart will display the selected statistic as an area plot, enabling a quick view of game trends.

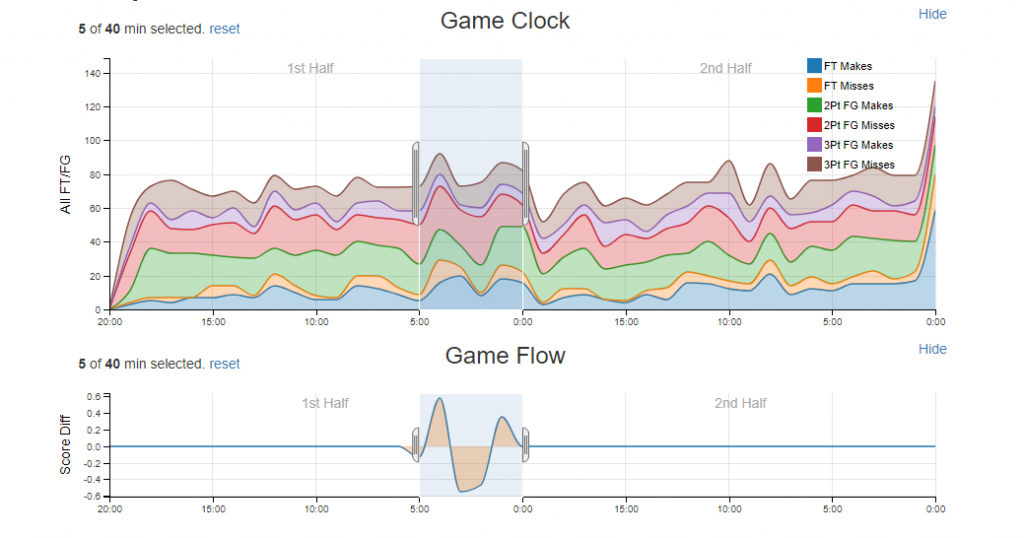
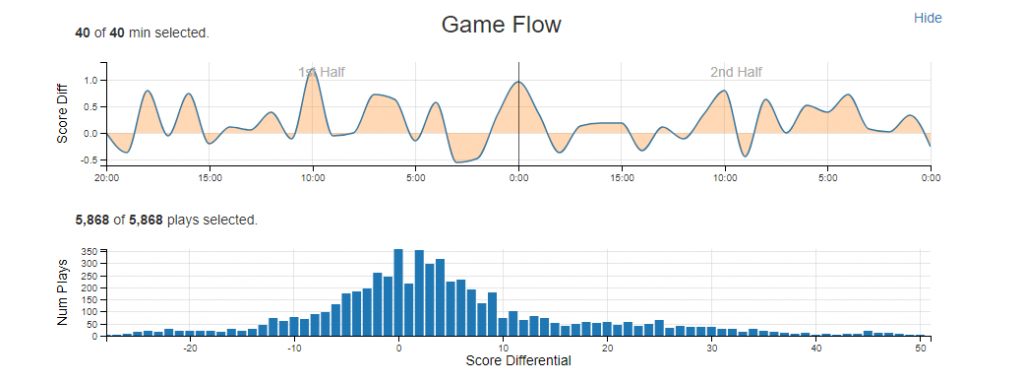
The Game Flow top chart displays the scoring differential between the selected team and the teams’ opponents. Thus, it can be used to identify segments of selected games where the team either outscored their opponents or the converse. The second Game Flow chart is a score differential chart. By clicking and dragging the mouse in this chart, it is possible to select a range of score differentials on which to filter. For instance, selecting from -5 to 5 would select all plays in which the team and its opponents were with 5 points of one another (perhaps disregarding ‘garbage time’ stats).
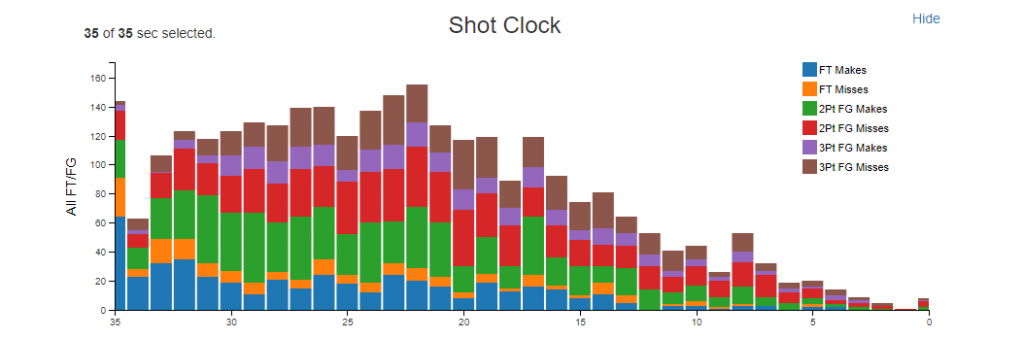
The Shot Clock chart enables the selection of shots according to where they occurred in the shot clock. As with the other charts, ranges can be selected by clicking and dragging to the desired range on the chart.
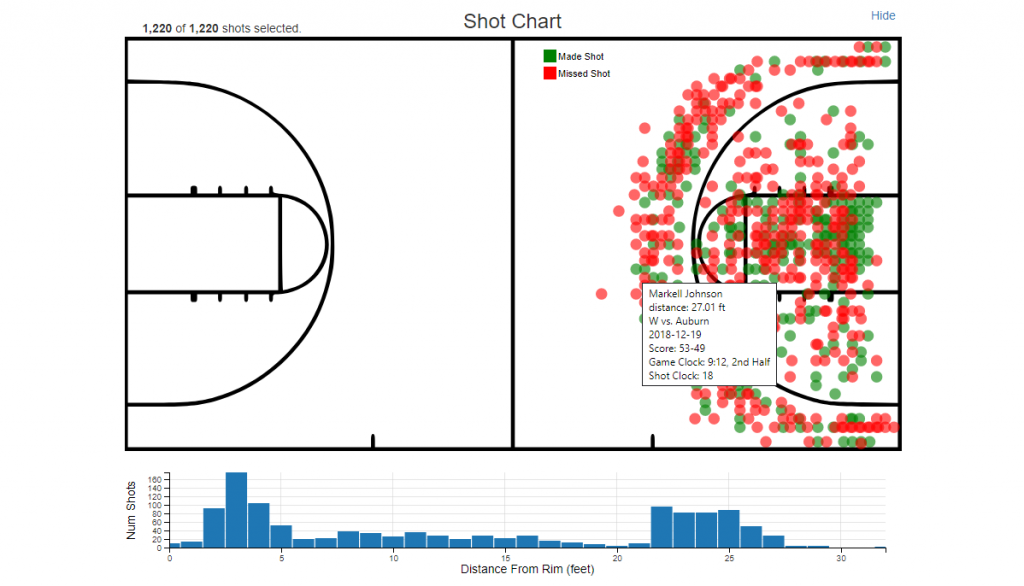
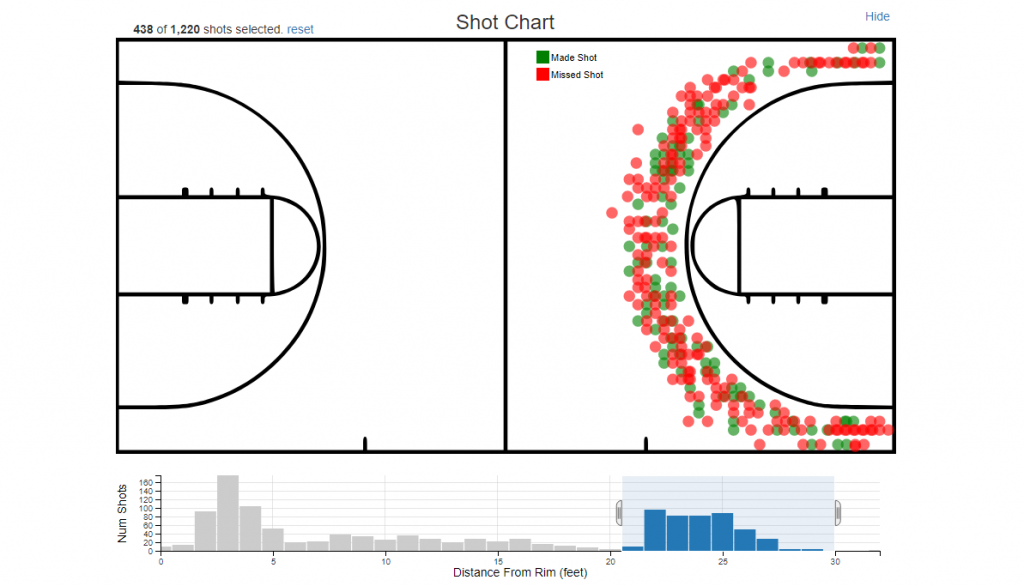
The Shot Chart shows the made and missed shots for the selected players, games, and game segments. Directly beneath the Shot Chart is a range chart which controls the selected shots. Click and drag to select a subset range of shot distances.
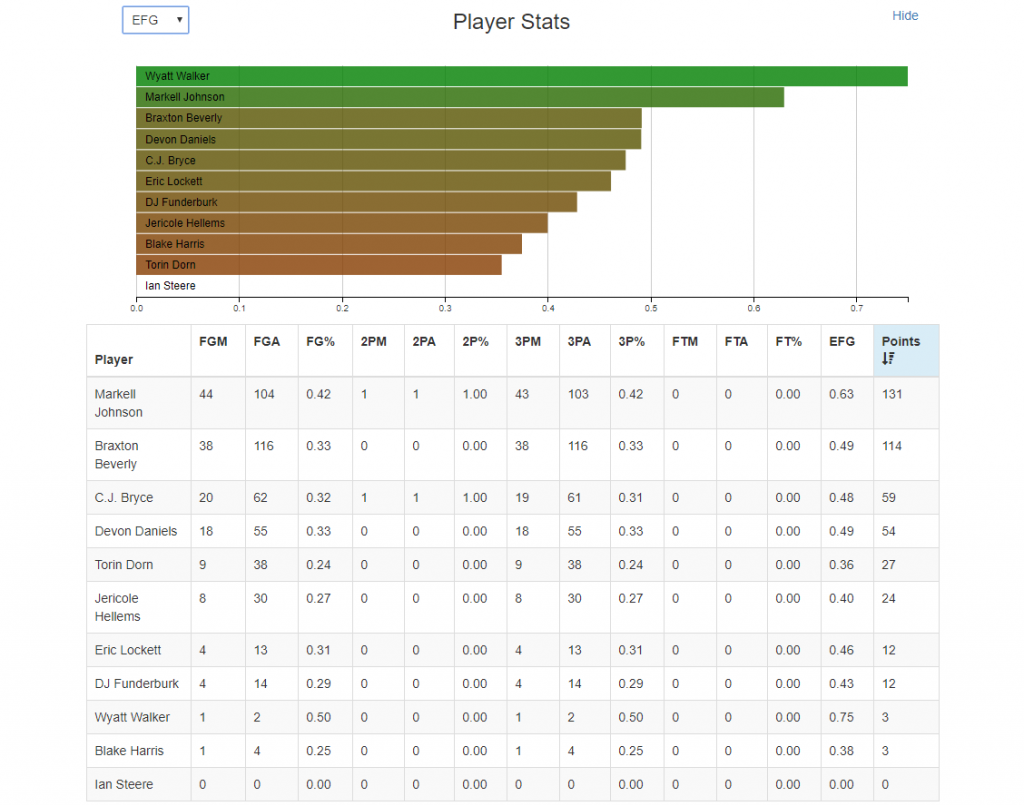
The Player Stats section shows the indicated statistic of the selected players. Individual players can be selected/unselected and the other charts will update accordingly.
The Offense and Defense Labs offer a unique and flexible way to select and explore situational statistics. To see how it works, check out this short tutorial video: