Trend Labs
November 3, 2019IMPORTANT: The Trend Labs can be very computationally and memory intensive! An up-to-date browser and recent hardware is required. If you’re running a Mosaic emulator on your Commodore 64, you’re going to want to avoid this tool.
In the team and conference sections, there are links to the Trend Labs. The Trend Labs are interactive tools that enable the ability to search through and select games that satisfy certain selection criteria. For instance, a few example questions that could be answered quickly and easily with this tool:
“What is our average PPP allowed in all non-conference away losses in 2014?”
or
“What was our record last year in conference home games where we shot better than 45% from 3-pt range?”
Questions like these can be answered after a mouse clicks. The idea is to enable the user to be able to quickly and easily identify patterns and trends by any custom selection criteria.
Both the Conference and Team trend labs have the same general structure: a series of controls and selectors in the top row: (1) a dropdown that allows the selection of Offense or Defense Stats (2) a dropdown for the particular statistic to explore (3) a time range to plot. A second set of controls appear on the right hand side: (4) a Save button that prints a copy of the Main Chart, (5) a settings button that opens the settings dialog, and (6) a Reset button that clears any and all selected filters.
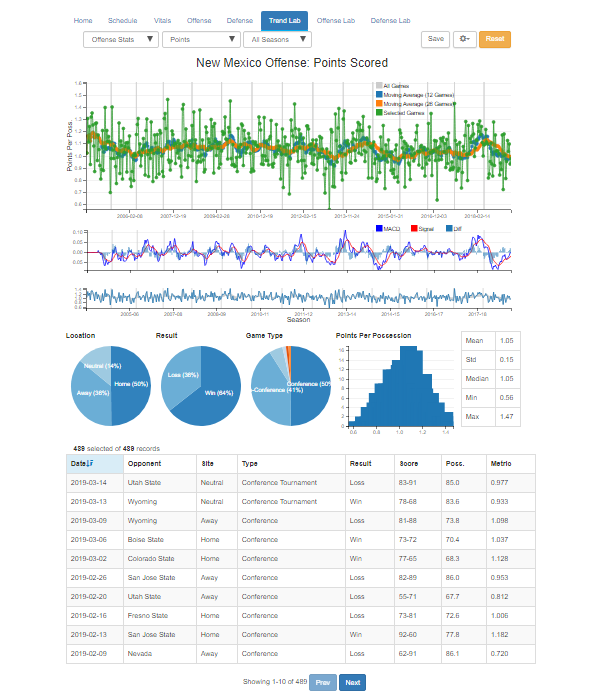
Beneath the control row, the first chart is the Main Chart and shows the plot of the offense or defense stat selected in the stat dropdown. The Team Trend Lab shows four series: the All Games series, which is the set of all games in the data set, a 12-game simple moving average of all of the games selected, and a 26-game simple moving average of the selected games. The conference Main Chart shows the simple moving average of each of the teams in the conference, with a slider control at the top to control the length of the moving average.
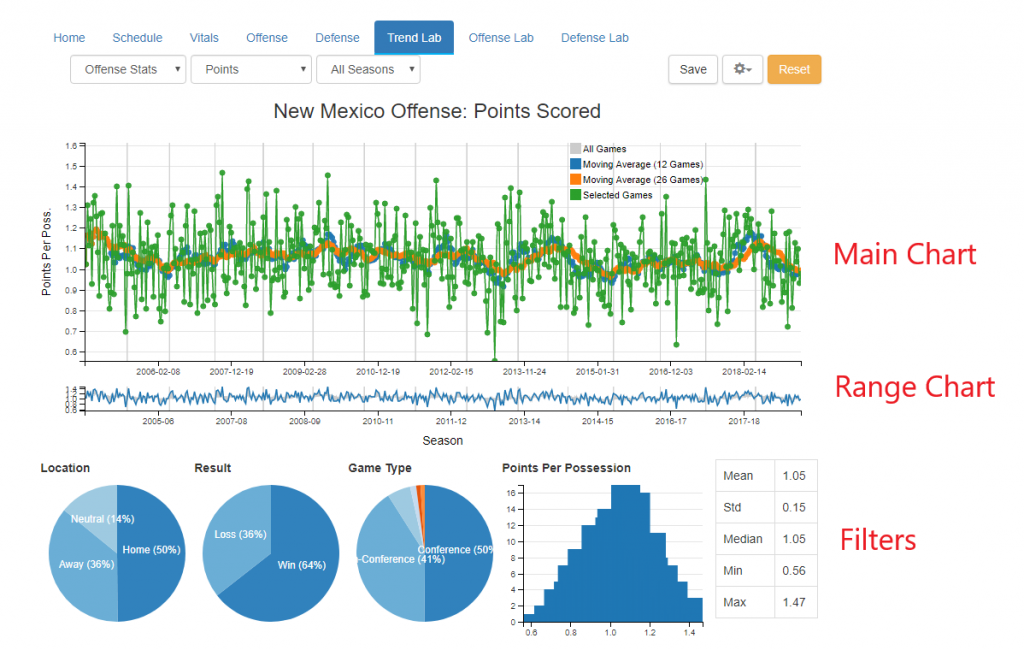
Beneath the Main Chart is the Range Chart. If the user is interested in a custom range that extends several seasons but not the entire range of season data – for instance, a range of dates that correspond to a particular head coach or player, then the range can be selected by clicking down on the mouse, holding the mouse button down while selecting the range, then letting the button depress when the slider is in the correct position. All of the Location, Result, Game Type, and Distribution filters will reflect the games in this selected range.
Note: In the Team Trend Lab settings dialog, there is is the option to chart the MACD for a particular statistic, which would appear between the Main Chart and the Range Chart. This chart adds a further level of computational complexity and should only be enabled at the end of the filtering/selection process, as it may (will) slow down the responsiveness of tool.
Beneath the Range Chart is the row of pie chart filters: Location filter, Result filter, Game Type filter, and the Distribution filter. One can select subsets of games by clicking on the different pie slices. Once a filter is selected, ‘Reset’ and ‘Invert’ links appear. ‘Reset’ will clear all selected pie slices for that filter, while ‘Invert’ will switch the selected slices with the unselected ones. The Distribution filter allows for a range of values to be selected, but clicking the mouse, sliding, and unclicking at the end of the range.
The following is a short introductory tutorial: