Is there a problem with the MWC’s new Nike ball?

January 8, 2020 0 By Neill White

Is there a problem with the MWC’s new Nike ball?

Updated with games through 3-11-2020 (END OF SEASON)

Spoiler: Almost. Two-tailed t-test for Adjusted EFG p-value is not statistically significant (p=0.114), but one-tailed test is pretty darned close (0.057).

For the 2019-2020 season, the Mountain West Conference partnered with ShotTracker and introduced a new technology for tracking the ball and player during games. Under the agreement, the equipment sponsor for each school would be responsible for providing balls implanted with a special sensor which would be used for conference home games. Of the eleven conference members, seven are Nike schools, three are Adidas schools, and one is Under Armor. Conference play started in early December and some of the players at the Nike schools are not happy with the new ball and have struggled with shooting and turnovers.

The following represents the current team split stats for different shooting metrics depending on the ball: New Nike ShotTracker ball or Other ball (old Nike ball, Wilson, Adidas, Under Armor, etc.):

Air Force Split Stat Totals
     Metric                  Other Ball       Nike ShotTracker Ball
        EFG                        0.57                        0.49
     FT Pct              266-354 (0.75)              193-274 (0.70)
     FG Pct              459-956 (0.48)              343-803 (0.43)
   2-pt Pct              291-547 (0.53)              236-478 (0.49)
   3-pt Pct              168-409 (0.41)              107-325 (0.33)
 Boise State Split Stat Totals
     Metric                  Other Ball       Nike ShotTracker Ball
        EFG                        0.51                        0.53
     FT Pct              288-387 (0.74)              215-283 (0.76)
     FG Pct             451-1002 (0.45)              378-851 (0.44)
   2-pt Pct              322-609 (0.53)              238-463 (0.51)
   3-pt Pct              129-393 (0.33)              140-388 (0.36)
 Fresno State Split Stat Totals
     Metric                  Other Ball       Nike ShotTracker Ball
        EFG                        0.51                        0.49
     FT Pct              184-273 (0.67)              181-246 (0.74)
     FG Pct              394-926 (0.43)              319-778 (0.41)
   2-pt Pct              235-467 (0.50)              194-402 (0.48)
   3-pt Pct              159-459 (0.35)              125-376 (0.33)
 New Mexico Split Stat Totals
     Metric                  Other Ball       Nike ShotTracker Ball
        EFG                        0.53                        0.52
     FT Pct              335-465 (0.72)              182-253 (0.72)
     FG Pct             550-1157 (0.48)              342-756 (0.45)
   2-pt Pct              423-757 (0.56)              239-452 (0.53)
   3-pt Pct              127-400 (0.32)              103-304 (0.34)
 San Diego State Split Stat Totals
     Metric                  Other Ball       Nike ShotTracker Ball
        EFG                        0.55                        0.55
     FT Pct              247-318 (0.78)              153-201 (0.76)
     FG Pct             541-1163 (0.47)              311-657 (0.47)
   2-pt Pct              349-666 (0.52)              212-389 (0.54)
   3-pt Pct              192-497 (0.39)               99-268 (0.37)
 UNLV Split Stat Totals
     Metric                  Other Ball       Nike ShotTracker Ball
        EFG                        0.49                        0.51
     FT Pct              257-368 (0.70)              185-271 (0.68)
     FG Pct             458-1084 (0.42)              354-792 (0.45)
   2-pt Pct              311-640 (0.49)              260-481 (0.54)
   3-pt Pct              147-444 (0.33)               94-311 (0.30)
 Utah State Split Stat Totals
     Metric                  Other Ball       Nike ShotTracker Ball
        EFG                        0.54                        0.49
     FT Pct              310-412 (0.75)              232-298 (0.78)
     FG Pct             559-1173 (0.48)              346-794 (0.44)
   2-pt Pct              403-730 (0.55)              254-492 (0.52)
   3-pt Pct              156-443 (0.35)               92-302 (0.30)
 Colorado State Split Stat Totals
     Metric                  Other Ball       Nike ShotTracker Ball
        EFG                        0.55                        0.49
     FT Pct              417-605 (0.69)                58-95 (0.61)
     FG Pct             721-1504 (0.48)              120-288 (0.42)
   2-pt Pct              504-920 (0.55)               79-167 (0.47)
   3-pt Pct              217-584 (0.37)               41-121 (0.34)
 Nevada Split Stat Totals
     Metric                  Other Ball       Nike ShotTracker Ball
        EFG                        0.53                        0.53
     FT Pct              312-409 (0.76)               88-122 (0.72)
     FG Pct             685-1528 (0.45)              156-353 (0.44)
   2-pt Pct              435-882 (0.49)               97-193 (0.50)
   3-pt Pct              250-646 (0.39)               59-160 (0.37)
 San Jose State Split Stat Totals
     Metric                  Other Ball       Nike ShotTracker Ball
        EFG                        0.46                        0.46
     FT Pct              363-506 (0.72)               91-128 (0.71)
     FG Pct             565-1445 (0.39)              163-426 (0.38)
   2-pt Pct              371-792 (0.47)              100-218 (0.46)
   3-pt Pct              194-653 (0.30)               63-208 (0.30)
 Wyoming Split Stat Totals
     Metric                  Other Ball       Nike ShotTracker Ball
        EFG                        0.48                        0.49
     FT Pct              319-443 (0.72)                67-88 (0.76)
     FG Pct             584-1433 (0.41)              128-306 (0.42)
   2-pt Pct              369-765 (0.48)               83-165 (0.50)
   3-pt Pct              215-668 (0.32)               45-141 (0.32)

The purpose of this study is to examine the effect the ball has had on shooting and turnovers to see if there is any statistical evidence supporting poorer performance with the new ball.

Methods

The seven Nike schools (Air Force, Boise State, Fresno State, New Mexico, San Diego State, UNLV, and Utah State) were grouped and their non-conference and conference shooting statistics were compared. It is assumed that in non-conference MWC home games, the old Nike ball is used while the MWC conference games use the new Nike ball with implanted sensor. There is at least one exception to this rule: in the Cal Poly at San Diego State non-conference game on 12/28/2019, the new Nike ball was used. Additionally, San Diego State asked for and received a waiver to use a different ball for their home conference games, starting with their game against Utah State on February 1st, 2020. Their remaining home games will be treated as using non-Nike ShotTracker balls. Additionally, according to this report, the MWC tournament will use a different Nike ShotTracker ball, and the games will be classified accordingly.

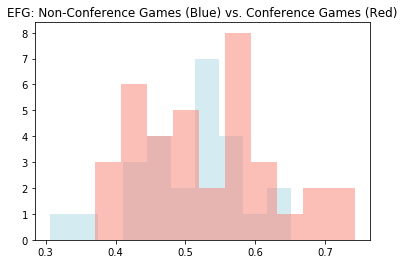
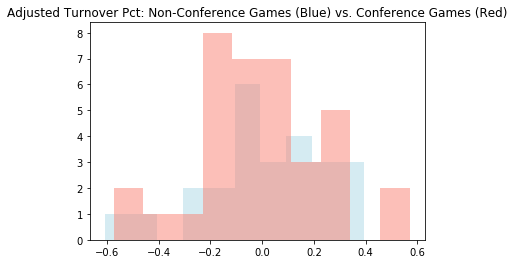
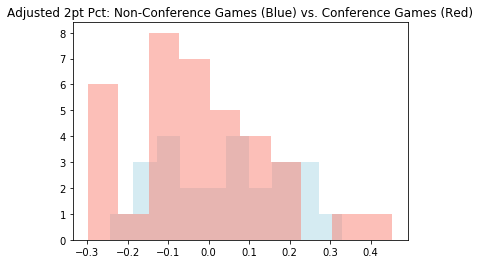
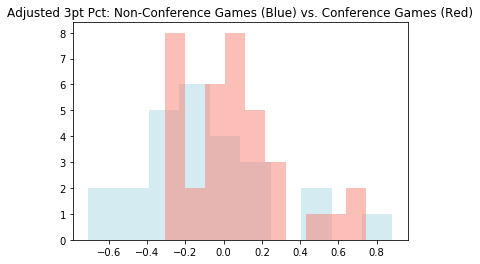
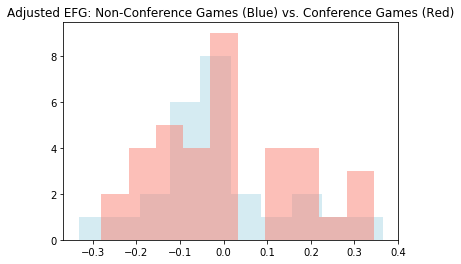
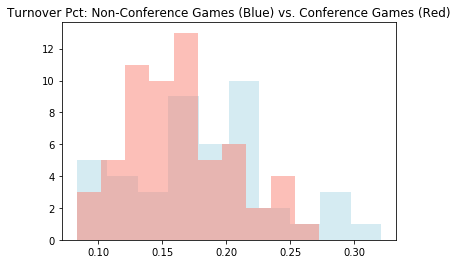
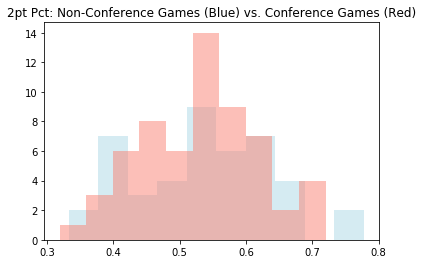
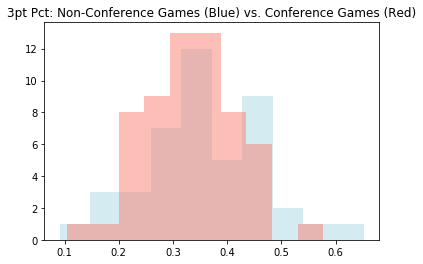
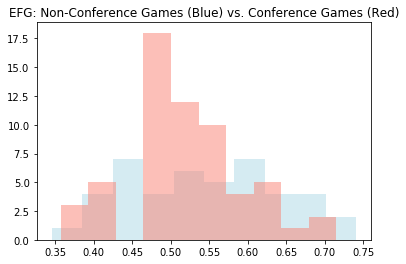
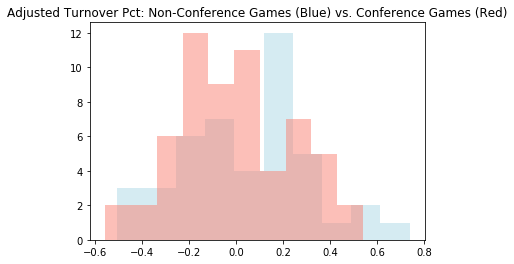
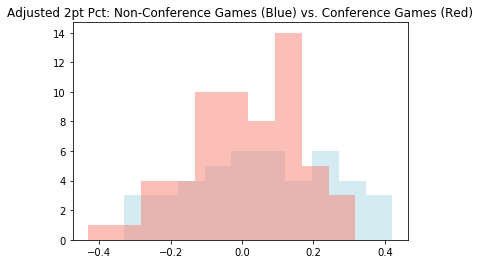
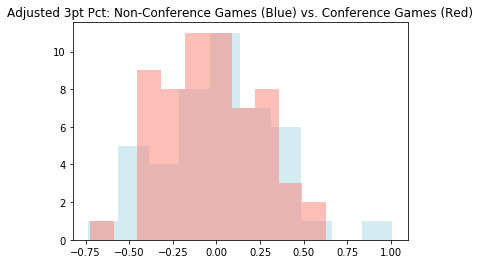
The specific metrics measured are turnover percentage and shooting in the form of Effective Field Goal (EFG) percentage (FGM + .5 * (3 pt FGM))/FGA. After the EFG study was done, a further analysis of sub-component 2pt and 3pt percentages was also carried out. Because there may be differences in shooting performance based on venue, only home team performance is measured. In addition to controlling for venue, it is necessary to control for the quality of the opponent. Most of the non-conference home games were against lower tier teams so it might not be surprising that shooting performance would suffer when league play started. So tests were done using both raw and adjusted metrics. For instance, in addition to EFG percentage, an adjusted EFG percentage was calculated, which is defined as (EFG-(avg Opponent EFG allowed)) / avg Opponent EFG allowed. Adjusted metrics were calculated for EFG, 2pt FG%, 3pt FG%, and Turnover %. The raw and adjusted metrics were then tested with an independent groups t-test to see if there was a statistically significant difference between the means of the non-conference (old Nike) performances compared to the conference (new Nike) performances.

Similarly, the four non-Nike schools (Nevada, San Jose State, Wyoming, and Colorado State) were grouped and subjected to the same tests. This group acts as a control group in that if we saw any statistically significant difference in metrics between non-conference and conference play, they would be addressed by the adjusted metrics.

Results

The four Non-Nike schools show no statistically significant differences between non-conference and conference games in any of the four measures (EFG, 2pt %, 3pt %, TO %) in either raw or adjusted form.

Non-Nike School Home Game Stats Summary (Control Group)
(CSU,NEV,SJSU,WYO)
MetricNon-Conf MeanConf Meanp-valueSignificant
tov_pct0.1680.1620.627
2pp0.5310.5140.526
3pp0.3110.3660.071
efg0.5030.5280.277
adj_tov0.014-0.0130.667
adj_2pp0.043-0.0230.126
adj_3pp-0.0830.0520.118
adj_efg-0.0140.0100.567

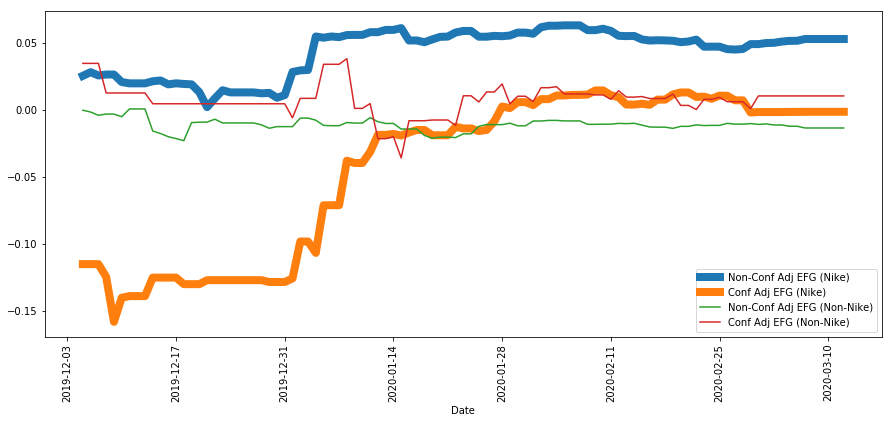
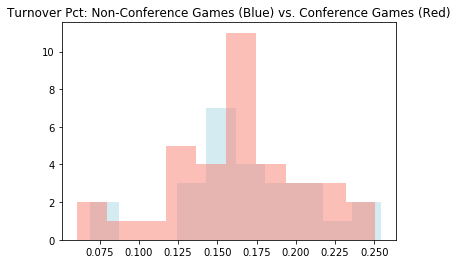
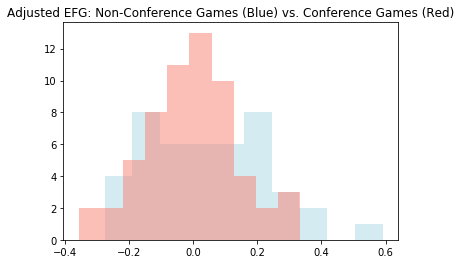
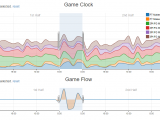
The Nike schools, however, showed a statistically significant difference between non-conference and conference games in turnover percentage and EFG earlier in the season. But surprisingly, the turnover percentage using the new ball was lower than the turnover percentage with the old ball. However, when accounting for the difference in opponents using the adjusted metrics, the differences are not statistically significant. For EFG, the difference in shooting performance has narrowed as the season has progressed (see below plot).

MWC Shooting (Adjusted EFG) Trends
Nike School Home Game Stats Summary
(AFA,BSU,FSU,SDSU,UNLV,UNM,USU)
MetricNon-Conf MeanConf Meanp-valueSignificant
tov_pct0.1820.1630.058
2pp0.5380.5320.787
3pp0.3600.3300.152
efg0.5480.5190.110
adj_tov0.045-0.0070.327
adj_2pp0.0550.0070.185
adj_3pp0.019-0.0220.502
adj_efg0.053-0.0020.114

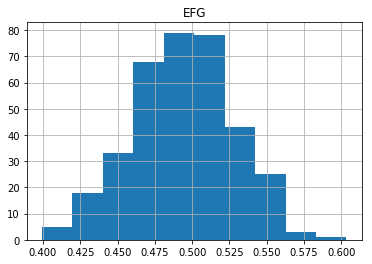
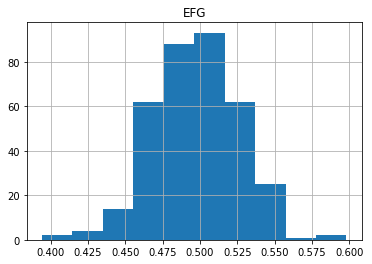
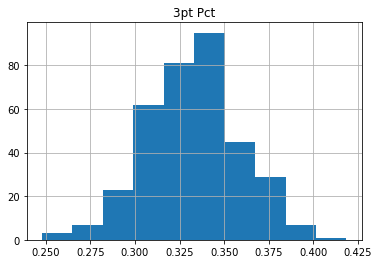
The adjusted EFG p-value of 0.114 means that if all things were equal and the same basketball were used in both conference and non-conference games (the null hypothesis), then we’d expect to see these means about 11.4% of the time and that lies above the standard threshold for statistical significance of 0.05 (where these means would be seen <5% of the time). The magnitude of the difference in shooting though is quite large. Nike schools in non-conference games had 0.092 0.051 higher adjusted EFG than those in conference. This is a large moderate difference in shooting performance. For reference, see below for the current distribution of EFG across all D1 teams. A 0.092 dip in EFG would drop the best shooting team in the nation to about the mean and an average shooting team would to amongst the worst. This effect size could be measured through Hedges g or Cohen’s d, but we’re probably already pushing the readers’ interest with all the measures so far. Suffice it to say, the drop in shooting performance is substantial moderate.

2019-2020 D1 EFG Distribution

Discussion

This study was done to explore the hypothesis that using the new Nike ball results in more turnovers and poorer shooting. These were the only two metrics that were investigated. This is important to highlight as multiple t-tests are employed and there is the danger of finding statistically significant differences between two population means simply by chance. The concept is exemplified here:

Look long enough and you’ll find significance!

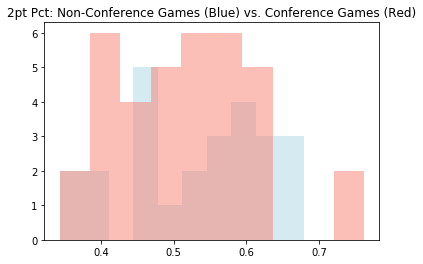
Only two hypotheses were explored: turnovers and shooting. After some evidence was found for shooting differences, two further shooting metrics were explored: 2pt shooting percentage and 3pt shooting percentage. If the entirety of available metrics were analyzed from the outset, there would likely be statistically significant differences in the means of one or more of the metrics that would be entirely due to chance. For instance, it might be found that using the new ball results in a statistically significant increase in offensive rebounding – but there would little plausible explanation for this effect.

Despite the two-tailed t-test having a p-value above the α threshold for statistical significance, the one-tailed test for poorer shooting (adjusted EFG) is statistically significant (simply calculated as the two-tailed p-value/2). The significance of a statistical test should be examined along with the effect size. For example, if it was found that the new ball decreased shooting performance in the form of EFG by 0.01 and this was statistically significant, it really wouldn’t matter. Yes, there is statistical significance, but the effect is very small. In this case, however, the effect size is very large and the both the one-tailed and two-tailed p-values are either close to or under the threshold for statistical significance, pointing to a real issue.

Full Results

MWC Home Games: Old Nike Ball vs. New Nike Ball

Non-Nike School Home Game Statistics (CSU,NEV,SJSU,WYO)

Measure: Turnover Pct

Non-Conference Games

dateteam_nameresultopponent_nametov_pctOpp Mean TO Pct Allowed
2019-11-05WyomingWIdaho State0.1820.162
2019-11-05NevadaLUtah0.0800.139
2019-11-05Colorado StateWDenver0.2020.160
2019-11-09NevadaWLoyola Mary0.1540.197
2019-11-10San Jose StateLPortland0.1790.165
2019-11-12NevadaWUT Arlington0.1990.155
2019-11-13WyomingLCSU Fullerton0.2210.185
2019-11-13Colorado StateWOmaha0.1290.138
2019-11-16WyomingLOregon State0.2100.153
2019-11-16NevadaLUSC0.1530.165
2019-11-19WyomingWDetroit Mercy0.1490.160
2019-11-20San Jose StateWGrambling0.2540.195
2019-11-20Colorado StateLArkansas St0.1280.174
2019-11-21WyomingWLouisiana0.1960.165
2019-11-23San Jose StateLPortland State0.2440.175
2019-12-01Colorado StateWUtah Valley0.1770.164
2019-12-04NevadaWSanta Clara0.1430.169
2019-12-10Colorado StateWSouth Dakota State0.1590.136
2019-12-13Colorado StateLColorado0.1650.166
2019-12-14San Jose StateLStanford0.1890.173
2019-12-14WyomingLN Colorado0.1370.162
2019-12-18WyomingLUtah Valley0.1530.164
2019-12-18NevadaWTexas Southern0.1760.182
2019-12-22San Jose StateLUC Riverside0.1490.162
2019-12-28San Jose StateWPepperdine0.0690.175

Conference Games

dateteam_nameresultopponent_nametov_pctOpp Mean TO Pct Allowed
2019-12-04WyomingLAir Force0.1660.161
2019-12-04Colorado StateLSan Diego State0.1260.172
2019-12-04San Jose StateLUtah State0.2090.168
2019-12-07WyomingLNew Mexico0.1590.182
2020-01-01NevadaWColorado State0.1910.152
2020-01-01San Jose StateWNew Mexico0.1570.182
2020-01-04Colorado StateWWyoming0.2290.186
2020-01-04NevadaWBoise State0.1940.205
2020-01-08San Jose StateWNevada0.1630.145
2020-01-08WyomingLSan Diego State0.1730.172
2020-01-11San Jose StateLColorado State0.1170.152
2020-01-11WyomingLUNLV0.0830.141
2020-01-14NevadaWWyoming0.1710.186
2020-01-15Colorado StateWNew Mexico0.2370.182
2020-01-18WyomingLFresno State0.2190.142
2020-01-22Colorado StateWFresno State0.0600.142
2020-01-22NevadaWUNLV0.0730.141
2020-01-25San Jose StateWAir Force0.1760.161
2020-01-25NevadaWNew Mexico0.1480.182
2020-01-28WyomingLUtah State0.1660.168
2020-01-29Colorado StateWNevada0.1380.145
2020-02-01Colorado StateWUNLV0.1590.141
2020-02-01San Jose StateLWyoming0.1890.186
2020-02-04NevadaWAir Force0.1660.161
2020-02-04WyomingLBoise State0.2320.205
2020-02-08NevadaWSan Jose State0.1240.160
2020-02-11Colorado StateLUtah State0.1570.168
2020-02-12San Jose StateLFresno State0.1180.142
2020-02-15WyomingLColorado State0.1250.152
2020-02-19San Jose StateLBoise State0.2030.205
2020-02-22NevadaWFresno State0.1450.142
2020-02-22Colorado StateWSan Jose State0.2510.160
2020-02-25WyomingLNevada0.1840.145
2020-02-29San Jose StateLUNLV0.1380.141
2020-02-29NevadaLSan Diego State0.1720.172
2020-02-29Colorado StateWAir Force0.1270.161
Non-Conference Games  tov_pct =  0.168 +/- 0.043 (Count: 25)
Conference Games      tov_pct =  0.162 +/- 0.044 (Count: 36)
Difference            tov_pct = -0.006 +/- 0.011
tov_pct t-test t-statistic: -0.488, p-value: 0.627

Measure: 2pt Pct

Non-Conference Games

dateteam_nameresultopponent_name2ppOpp Mean 2pt Pct Allowed
2019-11-05WyomingWIdaho State0.6670.576
2019-11-05NevadaLUtah0.4470.505
2019-11-05Colorado StateWDenver0.5930.561
2019-11-09NevadaWLoyola Mary0.6540.534
2019-11-10San Jose StateLPortland0.5310.537
2019-11-12NevadaWUT Arlington0.4590.474
2019-11-13WyomingLCSU Fullerton0.4550.509
2019-11-13Colorado StateWOmaha0.4870.523
2019-11-16WyomingLOregon State0.6250.516
2019-11-16NevadaLUSC0.3600.428
2019-11-19WyomingWDetroit Mercy0.5860.554
2019-11-20San Jose StateWGrambling0.6330.498
2019-11-20Colorado StateLArkansas St0.6050.515
2019-11-21WyomingWLouisiana0.6800.512
2019-11-23San Jose StateLPortland State0.4740.532
2019-12-01Colorado StateWUtah Valley0.5910.478
2019-12-04NevadaWSanta Clara0.5560.509
2019-12-10Colorado StateWSouth Dakota State0.6250.524
2019-12-13Colorado StateLColorado0.4000.461
2019-12-14San Jose StateLStanford0.3850.444
2019-12-14WyomingLN Colorado0.5290.508
2019-12-18WyomingLUtah Valley0.5480.478
2019-12-18NevadaWTexas Southern0.5590.520
2019-12-22San Jose StateLUC Riverside0.3440.454
2019-12-28San Jose StateWPepperdine0.4710.509

Conference Games

dateteam_nameresultopponent_name2ppOpp Mean 2pt Pct Allowed
2019-12-04WyomingLAir Force0.6000.572
2019-12-04Colorado StateLSan Diego State0.4710.484
2019-12-04San Jose StateLUtah State0.4640.529
2019-12-07WyomingLNew Mexico0.3890.542
2020-01-01NevadaWColorado State0.4710.525
2020-01-01San Jose StateWNew Mexico0.5880.542
2020-01-04Colorado StateWWyoming0.7500.516
2020-01-04NevadaWBoise State0.6330.573
2020-01-08San Jose StateWNevada0.5240.548
2020-01-08WyomingLSan Diego State0.4140.484
2020-01-11San Jose StateLColorado State0.3680.525
2020-01-11WyomingLUNLV0.3890.505
2020-01-14NevadaWWyoming0.5430.516
2020-01-15Colorado StateWNew Mexico0.5280.542
2020-01-18WyomingLFresno State0.3910.453
2020-01-22Colorado StateWFresno State0.5560.453
2020-01-22NevadaWUNLV0.4380.505
2020-01-25San Jose StateWAir Force0.5160.572
2020-01-25NevadaWNew Mexico0.5000.542
2020-01-28WyomingLUtah State0.4000.529
2020-01-29Colorado StateWNevada0.6180.548
2020-02-01Colorado StateWUNLV0.6000.505
2020-02-01San Jose StateLWyoming0.4620.516
2020-02-04NevadaWAir Force0.5830.572
2020-02-04WyomingLBoise State0.5670.573
2020-02-08NevadaWSan Jose State0.5560.561
2020-02-11Colorado StateLUtah State0.6110.529
2020-02-12San Jose StateLFresno State0.3430.453
2020-02-15WyomingLColorado State0.5000.525
2020-02-19San Jose StateLBoise State0.4640.573
2020-02-22NevadaWFresno State0.5150.453
2020-02-22Colorado StateWSan Jose State0.5810.561
2020-02-25WyomingLNevada0.4230.548
2020-02-29San Jose StateLUNLV0.4810.505
2020-02-29NevadaLSan Diego State0.5160.484
2020-02-29Colorado StateWAir Force0.7620.572
Non-Conference Games      2pp =  0.531 +/- 0.096 (Count: 25)
Conference Games          2pp =  0.514 +/- 0.097 (Count: 36)
Difference                2pp = -0.016 +/- 0.025
2pp t-test t-statistic: -0.638, p-value: 0.526

Measure: 3pt Pct

Non-Conference Games

dateteam_nameresultopponent_name3ppOpp Mean 3pt Pct Allowed
2019-11-05WyomingWIdaho State0.1000.344
2019-11-05NevadaLUtah0.3670.428
2019-11-05Colorado StateWDenver0.3040.332
2019-11-09NevadaWLoyola Mary0.2330.322
2019-11-10San Jose StateLPortland0.2310.371
2019-11-12NevadaWUT Arlington0.4760.322
2019-11-13WyomingLCSU Fullerton0.2860.336
2019-11-13Colorado StateWOmaha0.4550.393
2019-11-16WyomingLOregon State0.2080.353
2019-11-16NevadaLUSC0.3060.316
2019-11-19WyomingWDetroit Mercy0.3460.389
2019-11-20San Jose StateWGrambling0.2690.368
2019-11-20Colorado StateLArkansas St0.2630.330
2019-11-21WyomingWLouisiana0.2500.360
2019-11-23San Jose StateLPortland State0.2800.335
2019-12-01Colorado StateWUtah Valley0.5830.310
2019-12-04NevadaWSanta Clara0.5000.347
2019-12-10Colorado StateWSouth Dakota State0.3680.297
2019-12-13Colorado StateLColorado0.0910.295
2019-12-14San Jose StateLStanford0.2260.312
2019-12-14WyomingLN Colorado0.1820.299
2019-12-18WyomingLUtah Valley0.3810.310
2019-12-18NevadaWTexas Southern0.3480.342
2019-12-22San Jose StateLUC Riverside0.3460.325
2019-12-28San Jose StateWPepperdine0.3820.379

Conference Games

dateteam_nameresultopponent_name3ppOpp Mean 3pt Pct Allowed
2019-12-04WyomingLAir Force0.4520.382
2019-12-04Colorado StateLSan Diego State0.2220.286
2019-12-04San Jose StateLUtah State0.3810.337
2019-12-07WyomingLNew Mexico0.3570.389
2020-01-01NevadaWColorado State0.3460.308
2020-01-01San Jose StateWNew Mexico0.3640.389
2020-01-04Colorado StateWWyoming0.2170.289
2020-01-04NevadaWBoise State0.4830.379
2020-01-08San Jose StateWNevada0.2420.349
2020-01-08WyomingLSan Diego State0.2270.286
2020-01-11San Jose StateLColorado State0.3330.308
2020-01-11WyomingLUNLV0.3030.382
2020-01-14NevadaWWyoming0.2400.289
2020-01-15Colorado StateWNew Mexico0.6790.389
2020-01-18WyomingLFresno State0.3120.327
2020-01-22Colorado StateWFresno State0.5000.327
2020-01-22NevadaWUNLV0.4230.382
2020-01-25San Jose StateWAir Force0.4330.382
2020-01-25NevadaWNew Mexico0.4860.389
2020-01-28WyomingLUtah State0.2330.337
2020-01-29Colorado StateWNevada0.4090.349
2020-02-01Colorado StateWUNLV0.6470.382
2020-02-01San Jose StateLWyoming0.2900.289
2020-02-04NevadaWAir Force0.4000.382
2020-02-04WyomingLBoise State0.2630.379
2020-02-08NevadaWSan Jose State0.3570.355
2020-02-11Colorado StateLUtah State0.3640.337
2020-02-12San Jose StateLFresno State0.3000.327
2020-02-15WyomingLColorado State0.3100.308
2020-02-19San Jose StateLBoise State0.2670.379
2020-02-22NevadaWFresno State0.4230.327
2020-02-22Colorado StateWSan Jose State0.3680.355
2020-02-25WyomingLNevada0.3550.349
2020-02-29San Jose StateLUNLV0.3080.382
2020-02-29NevadaLSan Diego State0.4550.286
2020-02-29Colorado StateWAir Force0.4190.382
Non-Conference Games      3pp =  0.311 +/- 0.114 (Count: 25)
Conference Games          3pp =  0.366 +/- 0.107 (Count: 36)
Difference                3pp =  0.055 +/- 0.029
3pp t-test t-statistic: 1.848, p-value: 0.071

Measure: EFG

Non-Conference Games

dateteam_nameresultopponent_nameefgOpp Mean EFG Allowed
2019-11-05WyomingWIdaho State0.5270.562
2019-11-05NevadaLUtah0.4930.553
2019-11-05Colorado StateWDenver0.5300.534
2019-11-09NevadaWLoyola Mary0.4910.513
2019-11-10San Jose StateLPortland0.4480.547
2019-11-12NevadaWUT Arlington0.5520.478
2019-11-13WyomingLCSU Fullerton0.4440.504
2019-11-13Colorado StateWOmaha0.5570.551
2019-11-16WyomingLOregon State0.4690.521
2019-11-16NevadaLUSC0.4180.451
2019-11-19WyomingWDetroit Mercy0.5550.565
2019-11-20San Jose StateWGrambling0.5270.523
2019-11-20Colorado StateLArkansas St0.5350.512
2019-11-21WyomingWLouisiana0.5190.524
2019-11-23San Jose StateLPortland State0.4520.526
2019-12-01Colorado StateWUtah Valley0.6520.477
2019-12-04NevadaWSanta Clara0.6410.512
2019-12-10Colorado StateWSouth Dakota State0.5980.500
2019-12-13Colorado StateLColorado0.3060.459
2019-12-14San Jose StateLStanford0.3600.464
2019-12-14WyomingLN Colorado0.4670.492
2019-12-18WyomingLUtah Valley0.5580.477
2019-12-18NevadaWTexas Southern0.5440.521
2019-12-22San Jose StateLUC Riverside0.4220.466
2019-12-28San Jose StateWPepperdine0.5220.532

Conference Games

dateteam_nameresultopponent_nameefgOpp Mean EFG Allowed
2019-12-04WyomingLAir Force0.6430.575
2019-12-04Colorado StateLSan Diego State0.4230.459
2019-12-04San Jose StateLUtah State0.5100.514
2019-12-07WyomingLNew Mexico0.4530.560
2020-01-01NevadaWColorado State0.4920.499
2020-01-01San Jose StateWNew Mexico0.5670.560
2020-01-04Colorado StateWWyoming0.5590.481
2020-01-04NevadaWBoise State0.6780.568
2020-01-08San Jose StateWNevada0.4260.535
2020-01-08WyomingLSan Diego State0.3820.459
2020-01-11San Jose StateLColorado State0.4260.499
2020-01-11WyomingLUNLV0.4310.536
2020-01-14NevadaWWyoming0.4670.481
2020-01-15Colorado StateWNew Mexico0.7420.560
2020-01-18WyomingLFresno State0.4360.466
2020-01-22Colorado StateWFresno State0.6110.466
2020-01-22NevadaWUNLV0.5260.536
2020-01-25San Jose StateWAir Force0.5820.575
2020-01-25NevadaWNew Mexico0.6130.560
2020-01-28WyomingLUtah State0.3700.514
2020-01-29Colorado StateWNevada0.6160.535
2020-02-01Colorado StateWUNLV0.7210.536
2020-02-01San Jose StateLWyoming0.4470.481
2020-02-04NevadaWAir Force0.5900.575
2020-02-04WyomingLBoise State0.5000.568
2020-02-08NevadaWSan Jose State0.5480.555
2020-02-11Colorado StateLUtah State0.5860.514
2020-02-12San Jose StateLFresno State0.4000.466
2020-02-15WyomingLColorado State0.4830.499
2020-02-19San Jose StateLBoise State0.4310.568
2020-02-22NevadaWFresno State0.5680.466
2020-02-22Colorado StateWSan Jose State0.5700.555
2020-02-25WyomingLNevada0.4820.535
2020-02-29San Jose StateLUNLV0.4720.536
2020-02-29NevadaLSan Diego State0.5850.459
2020-02-29Colorado StateWAir Force0.6830.575
Non-Conference Games      efg =  0.503 +/- 0.078 (Count: 25)
Conference Games          efg =  0.528 +/- 0.096 (Count: 36)
Difference                efg =  0.025 +/- 0.022
efg t-test t-statistic: 1.098, p-value: 0.277

Measure: Adjusted Turnover Pct

Non-Conference Games

dateteam_nameresultopponent_nameadj_tovOpp Mean TO Pct Forced
2019-11-05WyomingWIdaho State0.1230.162
2019-11-05NevadaLUtah-0.4260.139
2019-11-05Colorado StateWDenver0.2600.160
2019-11-09NevadaWLoyola Mary-0.2170.197
2019-11-10San Jose StateLPortland0.0840.165
2019-11-12NevadaWUT Arlington0.2870.155
2019-11-13WyomingLCSU Fullerton0.1940.185
2019-11-13Colorado StateWOmaha-0.0660.138
2019-11-16WyomingLOregon State0.3730.153
2019-11-16NevadaLUSC-0.0750.165
2019-11-19WyomingWDetroit Mercy-0.0640.160
2019-11-20San Jose StateWGrambling0.3060.195
2019-11-20Colorado StateLArkansas St-0.2650.174
2019-11-21WyomingWLouisiana0.1890.165
2019-11-23San Jose StateLPortland State0.3940.175
2019-12-01Colorado StateWUtah Valley0.0820.164
2019-12-04NevadaWSanta Clara-0.1510.169
2019-12-10Colorado StateWSouth Dakota State0.1750.136
2019-12-13Colorado StateLColorado-0.0020.166
2019-12-14San Jose StateLStanford0.0950.173
2019-12-14WyomingLN Colorado-0.1550.162
2019-12-18WyomingLUtah Valley-0.0630.164
2019-12-18NevadaWTexas Southern-0.0360.182
2019-12-22San Jose StateLUC Riverside-0.0850.162
2019-12-28San Jose StateWPepperdine-0.6070.175

Conference Games

dateteam_nameresultopponent_nameadj_tovOpp Mean TO Pct Forced
2019-12-04WyomingLAir Force0.0300.161
2019-12-04Colorado StateLSan Diego State-0.2660.172
2019-12-04San Jose StateLUtah State0.2410.168
2019-12-07WyomingLNew Mexico-0.1300.182
2020-01-01NevadaWColorado State0.2590.152
2020-01-01San Jose StateWNew Mexico-0.1390.182
2020-01-04Colorado StateWWyoming0.2310.186
2020-01-04NevadaWBoise State-0.0520.205
2020-01-08San Jose StateWNevada0.1230.145
2020-01-08WyomingLSan Diego State0.0090.172
2020-01-11San Jose StateLColorado State-0.2260.152
2020-01-11WyomingLUNLV-0.4080.141
2020-01-14NevadaWWyoming-0.0810.186
2020-01-15Colorado StateWNew Mexico0.3000.182
2020-01-18WyomingLFresno State0.5420.142
2020-01-22Colorado StateWFresno State-0.5740.142
2020-01-22NevadaWUNLV-0.4830.141
2020-01-25San Jose StateWAir Force0.0950.161
2020-01-25NevadaWNew Mexico-0.1870.182
2020-01-28WyomingLUtah State-0.0130.168
2020-01-29Colorado StateWNevada-0.0450.145
2020-02-01Colorado StateWUNLV0.1280.141
2020-02-01San Jose StateLWyoming0.0160.186
2020-02-04NevadaWAir Force0.0280.161
2020-02-04WyomingLBoise State0.1290.205
2020-02-08NevadaWSan Jose State-0.2230.160
2020-02-11Colorado StateLUtah State-0.0670.168
2020-02-12San Jose StateLFresno State-0.1650.142
2020-02-15WyomingLColorado State-0.1770.152
2020-02-19San Jose StateLBoise State-0.0120.205
2020-02-22NevadaWFresno State0.0190.142
2020-02-22Colorado StateWSan Jose State0.5700.160
2020-02-25WyomingLNevada0.2690.145
2020-02-29San Jose StateLUNLV-0.0170.141
2020-02-29NevadaLSan Diego State0.0050.172
2020-02-29Colorado StateWAir Force-0.2100.161
Non-Conference Games  adj_tov =  0.014 +/- 0.238 (Count: 25)
Conference Games      adj_tov = -0.013 +/- 0.242 (Count: 36)
Difference            adj_tov = -0.027 +/- 0.062
adj_tov t-test t-statistic: -0.433, p-value: 0.667

Measure: Adjusted 2pt Pct

Non-Conference Games

dateteam_nameresultopponent_nameadj_2ppOpp Mean 2pt Pct Allowed
2019-11-05WyomingWIdaho State0.1570.576
2019-11-05NevadaLUtah-0.1140.505
2019-11-05Colorado StateWDenver0.0570.561
2019-11-09NevadaWLoyola Mary0.2240.534
2019-11-10San Jose StateLPortland-0.0110.537
2019-11-12NevadaWUT Arlington-0.0300.474
2019-11-13WyomingLCSU Fullerton-0.1070.509
2019-11-13Colorado StateWOmaha-0.0690.523
2019-11-16WyomingLOregon State0.2120.516
2019-11-16NevadaLUSC-0.1590.428
2019-11-19WyomingWDetroit Mercy0.0580.554
2019-11-20San Jose StateWGrambling0.2710.498
2019-11-20Colorado StateLArkansas St0.1750.515
2019-11-21WyomingWLouisiana0.3290.512
2019-11-23San Jose StateLPortland State-0.1090.532
2019-12-01Colorado StateWUtah Valley0.2370.478
2019-12-04NevadaWSanta Clara0.0910.509
2019-12-10Colorado StateWSouth Dakota State0.1930.524
2019-12-13Colorado StateLColorado-0.1330.461
2019-12-14San Jose StateLStanford-0.1350.444
2019-12-14WyomingLN Colorado0.0410.508
2019-12-18WyomingLUtah Valley0.1480.478
2019-12-18NevadaWTexas Southern0.0740.520
2019-12-22San Jose StateLUC Riverside-0.2430.454
2019-12-28San Jose StateWPepperdine-0.0760.509

Conference Games

dateteam_nameresultopponent_nameadj_2ppOpp Mean 2pt Pct Allowed
2019-12-04WyomingLAir Force0.0490.572
2019-12-04Colorado StateLSan Diego State-0.0270.484
2019-12-04San Jose StateLUtah State-0.1220.529
2019-12-07WyomingLNew Mexico-0.2830.542
2020-01-01NevadaWColorado State-0.1040.525
2020-01-01San Jose StateWNew Mexico0.0850.542
2020-01-04Colorado StateWWyoming0.4540.516
2020-01-04NevadaWBoise State0.1060.573
2020-01-08San Jose StateWNevada-0.0440.548
2020-01-08WyomingLSan Diego State-0.1450.484
2020-01-11San Jose StateLColorado State-0.2980.525
2020-01-11WyomingLUNLV-0.2290.505
2020-01-14NevadaWWyoming0.0520.516
2020-01-15Colorado StateWNew Mexico-0.0270.542
2020-01-18WyomingLFresno State-0.1360.453
2020-01-22Colorado StateWFresno State0.2270.453
2020-01-22NevadaWUNLV-0.1330.505
2020-01-25San Jose StateWAir Force-0.0980.572
2020-01-25NevadaWNew Mexico-0.0780.542
2020-01-28WyomingLUtah State-0.2440.529
2020-01-29Colorado StateWNevada0.1270.548
2020-02-01Colorado StateWUNLV0.1890.505
2020-02-01San Jose StateLWyoming-0.1050.516
2020-02-04NevadaWAir Force0.0200.572
2020-02-04WyomingLBoise State-0.0110.573
2020-02-08NevadaWSan Jose State-0.0100.561
2020-02-11Colorado StateLUtah State0.1550.529
2020-02-12San Jose StateLFresno State-0.2430.453
2020-02-15WyomingLColorado State-0.0480.525
2020-02-19San Jose StateLBoise State-0.1890.573
2020-02-22NevadaWFresno State0.1380.453
2020-02-22Colorado StateWSan Jose State0.0350.561
2020-02-25WyomingLNevada-0.2280.548
2020-02-29San Jose StateLUNLV-0.0460.505
2020-02-29NevadaLSan Diego State0.0670.484
2020-02-29Colorado StateWAir Force0.3320.572
Non-Conference Games  adj_2pp =  0.043 +/- 0.154 (Count: 25)
Conference Games      adj_2pp = -0.023 +/- 0.168 (Count: 36)
Difference            adj_2pp = -0.066 +/- 0.042
adj_2pp t-test t-statistic: -1.554, p-value: 0.126

Measure: Adjusted 3pt Pct

Non-Conference Games

dateteam_nameresultopponent_nameadj_3ppOpp Mean 3pt Pct Allowed
2019-11-05WyomingWIdaho State-0.7090.344
2019-11-05NevadaLUtah-0.1430.428
2019-11-05Colorado StateWDenver-0.0840.332
2019-11-09NevadaWLoyola Mary-0.2760.322
2019-11-10San Jose StateLPortland-0.3780.371
2019-11-12NevadaWUT Arlington0.4790.322
2019-11-13WyomingLCSU Fullerton-0.1490.336
2019-11-13Colorado StateWOmaha0.1560.393
2019-11-16WyomingLOregon State-0.4100.353
2019-11-16NevadaLUSC-0.0320.316
2019-11-19WyomingWDetroit Mercy-0.1100.389
2019-11-20San Jose StateWGrambling-0.2680.368
2019-11-20Colorado StateLArkansas St-0.2020.330
2019-11-21WyomingWLouisiana-0.3050.360
2019-11-23San Jose StateLPortland State-0.1650.335
2019-12-01Colorado StateWUtah Valley0.8820.310
2019-12-04NevadaWSanta Clara0.4400.347
2019-12-10Colorado StateWSouth Dakota State0.2410.297
2019-12-13Colorado StateLColorado-0.6920.295
2019-12-14San Jose StateLStanford-0.2770.312
2019-12-14WyomingLN Colorado-0.3920.299
2019-12-18WyomingLUtah Valley0.2290.310
2019-12-18NevadaWTexas Southern0.0170.342
2019-12-22San Jose StateLUC Riverside0.0650.325
2019-12-28San Jose StateWPepperdine0.0080.379

Conference Games

dateteam_nameresultopponent_nameadj_3ppOpp Mean 3pt Pct Allowed
2019-12-04WyomingLAir Force0.1820.382
2019-12-04Colorado StateLSan Diego State-0.2220.286
2019-12-04San Jose StateLUtah State0.1310.337
2019-12-07WyomingLNew Mexico-0.0820.389
2020-01-01NevadaWColorado State0.1250.308
2020-01-01San Jose StateWNew Mexico-0.0660.389
2020-01-04Colorado StateWWyoming-0.2480.289
2020-01-04NevadaWBoise State0.2740.379
2020-01-08San Jose StateWNevada-0.3050.349
2020-01-08WyomingLSan Diego State-0.2050.286
2020-01-11San Jose StateLColorado State0.0830.308
2020-01-11WyomingLUNLV-0.2060.382
2020-01-14NevadaWWyoming-0.1700.289
2020-01-15Colorado StateWNew Mexico0.7440.389
2020-01-18WyomingLFresno State-0.0440.327
2020-01-22Colorado StateWFresno State0.5290.327
2020-01-22NevadaWUNLV0.1080.382
2020-01-25San Jose StateWAir Force0.1340.382
2020-01-25NevadaWNew Mexico0.2480.389
2020-01-28WyomingLUtah State-0.3080.337
2020-01-29Colorado StateWNevada0.1720.349
2020-02-01Colorado StateWUNLV0.6950.382
2020-02-01San Jose StateLWyoming0.0040.289
2020-02-04NevadaWAir Force0.0470.382
2020-02-04WyomingLBoise State-0.3060.379
2020-02-08NevadaWSan Jose State0.0060.355
2020-02-11Colorado StateLUtah State0.0790.337
2020-02-12San Jose StateLFresno State-0.0830.327
2020-02-15WyomingLColorado State0.0090.308
2020-02-19San Jose StateLBoise State-0.2960.379
2020-02-22NevadaWFresno State0.2940.327
2020-02-22Colorado StateWSan Jose State0.0380.355
2020-02-25WyomingLNevada0.0170.349
2020-02-29San Jose StateLUNLV-0.1940.382
2020-02-29NevadaLSan Diego State0.5910.286
2020-02-29Colorado StateWAir Force0.0970.382
Non-Conference Games  adj_3pp = -0.083 +/- 0.350 (Count: 25)
Conference Games      adj_3pp =  0.052 +/- 0.268 (Count: 36)
Difference            adj_3pp =  0.135 +/- 0.083
adj_3pp t-test t-statistic: 1.594, p-value: 0.118

Measure: Adjusted EFG

Non-Conference Games

dateteam_nameresultopponent_nameadj_efgOpp Mean EFG Allowed
2019-11-05WyomingWIdaho State-0.0620.562
2019-11-05NevadaLUtah-0.1100.553
2019-11-05Colorado StateWDenver-0.0080.534
2019-11-09NevadaWLoyola Mary-0.0430.513
2019-11-10San Jose StateLPortland-0.1800.547
2019-11-12NevadaWUT Arlington0.1530.478
2019-11-13WyomingLCSU Fullerton-0.1170.504
2019-11-13Colorado StateWOmaha0.0120.551
2019-11-16WyomingLOregon State-0.1010.521
2019-11-16NevadaLUSC-0.0730.451
2019-11-19WyomingWDetroit Mercy-0.0180.565
2019-11-20San Jose StateWGrambling0.0070.523
2019-11-20Colorado StateLArkansas St0.0450.512
2019-11-21WyomingWLouisiana-0.0110.524
2019-11-23San Jose StateLPortland State-0.1400.526
2019-12-01Colorado StateWUtah Valley0.3650.477
2019-12-04NevadaWSanta Clara0.2520.512
2019-12-10Colorado StateWSouth Dakota State0.1950.500
2019-12-13Colorado StateLColorado-0.3320.459
2019-12-14San Jose StateLStanford-0.2240.464
2019-12-14WyomingLN Colorado-0.0520.492
2019-12-18WyomingLUtah Valley0.1680.477
2019-12-18NevadaWTexas Southern0.0440.521
2019-12-22San Jose StateLUC Riverside-0.0930.466
2019-12-28San Jose StateWPepperdine-0.0190.532

Conference Games

dateteam_nameresultopponent_nameadj_efgOpp Mean EFG Allowed
2019-12-04WyomingLAir Force0.1190.575
2019-12-04Colorado StateLSan Diego State-0.0780.459
2019-12-04San Jose StateLUtah State-0.0070.514
2019-12-07WyomingLNew Mexico-0.1900.560
2020-01-01NevadaWColorado State-0.0150.499
2020-01-01San Jose StateWNew Mexico0.0130.560
2020-01-04Colorado StateWWyoming0.1620.481
2020-01-04NevadaWBoise State0.1930.568
2020-01-08San Jose StateWNevada-0.2040.535
2020-01-08WyomingLSan Diego State-0.1660.459
2020-01-11San Jose StateLColorado State-0.1460.499
2020-01-11WyomingLUNLV-0.1960.536
2020-01-14NevadaWWyoming-0.0290.481
2020-01-15Colorado StateWNew Mexico0.3260.560
2020-01-18WyomingLFresno State-0.0640.466
2020-01-22Colorado StateWFresno State0.3110.466
2020-01-22NevadaWUNLV-0.0200.536
2020-01-25San Jose StateWAir Force0.0130.575
2020-01-25NevadaWNew Mexico0.0950.560
2020-01-28WyomingLUtah State-0.2800.514
2020-01-29Colorado StateWNevada0.1520.535
2020-02-01Colorado StateWUNLV0.3440.536
2020-02-01San Jose StateLWyoming-0.0690.481
2020-02-04NevadaWAir Force0.0270.575
2020-02-04WyomingLBoise State-0.1200.568
2020-02-08NevadaWSan Jose State-0.0130.555
2020-02-11Colorado StateLUtah State0.1410.514
2020-02-12San Jose StateLFresno State-0.1420.466
2020-02-15WyomingLColorado State-0.0330.499
2020-02-19San Jose StateLBoise State-0.2410.568
2020-02-22NevadaWFresno State0.2180.466
2020-02-22Colorado StateWSan Jose State0.0270.555
2020-02-25WyomingLNevada-0.0980.535
2020-02-29San Jose StateLUNLV-0.1210.536
2020-02-29NevadaLSan Diego State0.2750.459
2020-02-29Colorado StateWAir Force0.1880.575
Non-Conference Games  adj_efg = -0.014 +/- 0.149 (Count: 25)
Conference Games      adj_efg =  0.010 +/- 0.165 (Count: 36)
Difference            adj_efg =  0.024 +/- 0.041
adj_efg t-test t-statistic: 0.576, p-value: 0.567

Non-Nike School Home Game Stats Summary

MetricNon-Conf MeanConf Meanp-valueSignificant
tov_pct0.1680.1620.627
2pp0.5310.5140.526
3pp0.3110.3660.071
efg0.5030.5280.277
adj_tov0.014-0.0130.667
adj_2pp0.043-0.0230.126
adj_3pp-0.0830.0520.118
adj_efg-0.0140.0100.567

Nike School Home Game Statistics (AFA,BSU,FSU,SDSU,UNLV,UNM,USU)

Measure: Turnover Pct

Non-Conference Games

dateteam_nameresultopponent_nametov_pctOpp Mean TO Pct Allowed
2019-11-05San Diego StateWTexas Southern0.1790.182
2019-11-05Utah StateWMontana State0.1190.147
2019-11-05UNLVWPurdue Fort Wayne0.1940.169
2019-11-07Air ForceLIdaho State0.1840.162
2019-11-08Utah StateWWeber State0.1020.165
2019-11-09Air ForceWTexas State0.1770.184
2019-11-09UNLVLKansas State0.3210.215
2019-11-09New MexicoWCSU Northridge0.1550.167
2019-11-10Fresno StateWWinthrop0.2070.176
2019-11-12Utah StateWDenver0.1550.160
2019-11-13San Diego StateWGrand Canyon0.1060.132
2019-11-13New MexicoWGreen Bay0.2060.182
2019-11-15Utah StateWNorth Carolina A&T0.2080.177
2019-11-15Boise StateLUC Irvine0.1720.155
2019-11-16New MexicoWMcNeese0.1930.171
2019-11-18Utah StateWUTSA0.2120.154
2019-11-18UNLVWAbil Christian0.1930.243
2019-11-20Boise StateWBYU0.1270.178
2019-11-20UNLVLTexas State0.2220.184
2019-11-22San Diego StateWLong Island University0.0840.169
2019-11-23UNLVLSMU0.1370.166
2019-11-25San Diego StateWTennessee State0.1590.143
2019-11-26UNLVWJackson State0.2760.228
2019-11-29Boise StateWUNC Wilmington0.0950.154
2019-12-01New MexicoWMontana0.1310.189
2019-12-01Air ForceWJackson State0.2550.228
2019-12-14Boise StateWAlabama State0.1640.178
2019-12-14New MexicoWNew Mexico St0.2280.193
2019-12-17New MexicoWGrand Canyon0.2300.132
2019-12-18UNLVLPacific0.2210.170
2019-12-20Fresno StateWIUPUI0.1430.160
2019-12-21Air ForceLDrake0.2150.161
2019-12-21UNLVWRobert Morris0.1780.201
2019-12-22New MexicoWHouston Baptist0.1260.164
2019-12-23Fresno StateLSan Francisco0.2180.186
2019-12-28Boise StateWCSU Northridge0.1680.167
2019-12-28UNLVWE Michigan0.2760.208
2019-12-28Fresno StateLUC Riverside0.2180.162
2019-12-29New MexicoWUC Davis0.2810.182
2019-12-31Air ForceWUC Riverside0.0870.162
2020-02-01San Diego StateWUtah State0.1270.168
2020-02-11San Diego StateWNew Mexico0.2020.182
2020-02-22San Diego StateLUNLV0.1820.141
2020-02-25San Diego StateWColorado State0.1750.152

Conference Games

dateteam_nameresultopponent_nametov_pctOpp Mean TO Pct Allowed
2019-12-04New MexicoWBoise State0.0910.205
2019-12-04Fresno StateLUNLV0.1090.141
2019-12-07Air ForceLNevada0.1180.145
2019-12-07Utah StateWFresno State0.1310.142
2019-12-07Boise StateWColorado State0.1360.152
2019-12-08San Diego StateWSan José St0.1220.160
2019-12-28San Diego StateWCal Poly0.1430.161
2020-01-01San Diego StateWFresno State0.2180.142
2020-01-01UNLVWUtah State0.2090.168
2020-01-01Boise StateWWyoming0.2050.186
2020-01-04Utah StateLSan Diego State0.1610.172
2020-01-04UNLVWAir Force0.1350.161
2020-01-04Fresno StateWSan Jose State0.1270.160
2020-01-07New MexicoWFresno State0.1160.142
2020-01-07Air ForceWUtah State0.1740.168
2020-01-08Boise StateWUNLV0.1720.141
2020-01-11Utah StateWNevada0.1820.145
2020-01-11New MexicoWAir Force0.2470.161
2020-01-11San Diego StateWBoise State0.1270.205
2020-01-14Fresno StateLSan Diego State0.1770.172
2020-01-15UNLVWSan Jose State0.2060.160
2020-01-15Air ForceWBoise State0.0970.205
2020-01-18UNLVWNew Mexico0.1260.182
2020-01-18Boise StateWUtah State0.1800.168
2020-01-18San Diego StateWNevada0.1710.145
2020-01-18Air ForceLColorado State0.2070.152
2020-01-21Utah StateWAir Force0.1460.161
2020-01-21San Diego StateWWyoming0.1640.186
2020-01-21New MexicoWSan Jose State0.1260.160
2020-01-25Fresno StateLBoise State0.2730.205
2020-01-25Utah StateWColorado State0.2130.152
2020-01-26UNLVLSan Diego State0.1400.172
2020-01-28Air ForceLFresno State0.1270.142
2020-01-29Boise StateWSan Jose State0.1480.160
2020-01-29New MexicoLSan Diego State0.1470.172
2020-02-01Fresno StateWNew Mexico0.2370.182
2020-02-01Boise StateWNevada0.1540.145
2020-02-04Fresno StateLColorado State0.1740.152
2020-02-05Utah StateWUNLV0.1860.141
2020-02-08Utah StateWBoise State0.1770.205
2020-02-08Air ForceLSan Diego State0.1250.172
2020-02-08UNLVWFresno State0.1060.142
2020-02-08New MexicoWWyoming0.1500.186
2020-02-11Boise StateWAir Force0.1140.161
2020-02-12UNLVLNevada0.0830.145
2020-02-15Air ForceWSan Jose State0.1610.160
2020-02-15Fresno StateLUtah State0.1450.168
2020-02-15New MexicoLUNLV0.1730.141
2020-02-16Boise StateLSan Diego State0.2440.172
2020-02-18New MexicoLNevada0.1480.145
2020-02-18UNLVWColorado State0.1560.152
2020-02-19Utah StateWWyoming0.2220.186
2020-02-19Fresno StateWAir Force0.1740.161
2020-02-22Air ForceLWyoming0.1820.186
2020-02-23Boise StateWNew Mexico0.2140.182
2020-02-25Utah StateWSan Jose State0.1610.160
2020-02-26UNLVWBoise State0.1390.205
2020-02-26Air ForceWNew Mexico0.2370.182
2020-02-29New MexicoWUtah State0.1650.168
2020-02-29Fresno StateWWyoming0.1860.186
Non-Conference Games  tov_pct =  0.182 +/- 0.054 (Count: 44)
Conference Games      tov_pct =  0.163 +/- 0.041 (Count: 60)
Difference            tov_pct = -0.019 +/- 0.010
tov_pct t-test t-statistic: -1.923, p-value: 0.058

Measure: 2pt Pct

Non-Conference Games

dateteam_nameresultopponent_name2ppOpp Mean 2pt Pct Allowed
2019-11-05San Diego StateWTexas Southern0.3960.520
2019-11-05Utah StateWMontana State0.4000.493
2019-11-05UNLVWPurdue Fort Wayne0.6000.548
2019-11-07Air ForceLIdaho State0.6340.576
2019-11-08Utah StateWWeber State0.6200.534
2019-11-09Air ForceWTexas State0.4550.478
2019-11-09UNLVLKansas State0.4060.536
2019-11-09New MexicoWCSU Northridge0.6820.515
2019-11-10Fresno StateWWinthrop0.5000.513
2019-11-12Utah StateWDenver0.4860.561
2019-11-13San Diego StateWGrand Canyon0.5950.478
2019-11-13New MexicoWGreen Bay0.5120.522
2019-11-15Utah StateWNorth Carolina A&T0.6490.530
2019-11-15Boise StateLUC Irvine0.3820.441
2019-11-16New MexicoWMcNeese0.5130.478
2019-11-18Utah StateWUTSA0.5950.535
2019-11-18UNLVWAbil Christian0.7500.535
2019-11-20Boise StateWBYU0.5240.567
2019-11-20UNLVLTexas State0.3330.478
2019-11-22San Diego StateWLong Island University0.5950.485
2019-11-23UNLVLSMU0.3500.523
2019-11-25San Diego StateWTennessee State0.4000.487
2019-11-26UNLVWJackson State0.6390.479
2019-11-29Boise StateWUNC Wilmington0.6410.531
2019-12-01New MexicoWMontana0.4210.506
2019-12-01Air ForceWJackson State0.6800.479
2019-12-14Boise StateWAlabama State0.6560.510
2019-12-14New MexicoWNew Mexico St0.5000.541
2019-12-17New MexicoWGrand Canyon0.5670.478
2019-12-18UNLVLPacific0.5770.450
2019-12-20Fresno StateWIUPUI0.5310.506
2019-12-21Air ForceLDrake0.5380.473
2019-12-21UNLVWRobert Morris0.6220.542
2019-12-22New MexicoWHouston Baptist0.7780.562
2019-12-23Fresno StateLSan Francisco0.5450.512
2019-12-28Boise StateWCSU Northridge0.6250.515
2019-12-28UNLVWE Michigan0.4390.452
2019-12-28Fresno StateLUC Riverside0.4620.454
2019-12-29New MexicoWUC Davis0.5380.556
2019-12-31Air ForceWUC Riverside0.5760.454
2020-02-01San Diego StateWUtah State0.5500.529
2020-02-11San Diego StateWNew Mexico0.5280.542
2020-02-22San Diego StateLUNLV0.4810.505
2020-02-25San Diego StateWColorado State0.3810.525

Conference Games

dateteam_nameresultopponent_name2ppOpp Mean 2pt Pct Allowed
2019-12-04New MexicoWBoise State0.6050.573
2019-12-04Fresno StateLUNLV0.4740.505
2019-12-07Air ForceLNevada0.5330.548
2019-12-07Utah StateWFresno State0.4150.453
2019-12-07Boise StateWColorado State0.5000.525
2019-12-08San Diego StateWSan José St0.3190.561
2019-12-28San Diego StateWCal Poly0.5760.502
2020-01-01San Diego StateWFresno State0.5140.453
2020-01-01UNLVWUtah State0.5410.529
2020-01-01Boise StateWWyoming0.4720.516
2020-01-04Utah StateLSan Diego State0.5480.484
2020-01-04UNLVWAir Force0.7200.572
2020-01-04Fresno StateWSan Jose State0.5220.561
2020-01-07New MexicoWFresno State0.5000.453
2020-01-07Air ForceWUtah State0.5830.529
2020-01-08Boise StateWUNLV0.4190.505
2020-01-11Utah StateWNevada0.6000.548
2020-01-11New MexicoWAir Force0.6860.572
2020-01-11San Diego StateWBoise State0.5500.573
2020-01-14Fresno StateLSan Diego State0.3950.484
2020-01-15UNLVWSan Jose State0.6390.561
2020-01-15Air ForceWBoise State0.5790.573
2020-01-18UNLVWNew Mexico0.6120.542
2020-01-18Boise StateWUtah State0.5310.529
2020-01-18San Diego StateWNevada0.3940.548
2020-01-18Air ForceLColorado State0.5520.525
2020-01-21Utah StateWAir Force0.4850.572
2020-01-21San Diego StateWWyoming0.6150.516
2020-01-21New MexicoWSan Jose State0.6760.561
2020-01-25Fresno StateLBoise State0.4440.573
2020-01-25Utah StateWColorado State0.6670.525
2020-01-26UNLVLSan Diego State0.5520.484
2020-01-28Air ForceLFresno State0.4330.453
2020-01-29Boise StateWSan Jose State0.5940.561
2020-01-29New MexicoLSan Diego State0.4290.484
2020-02-01Fresno StateWNew Mexico0.7140.542
2020-02-01Boise StateWNevada0.5220.548
2020-02-04Fresno StateLColorado State0.5590.525
2020-02-05Utah StateWUNLV0.5620.505
2020-02-08Utah StateWBoise State0.5480.573
2020-02-08Air ForceLSan Diego State0.5000.484
2020-02-08UNLVWFresno State0.4410.453
2020-02-08New MexicoWWyoming0.5790.516
2020-02-11Boise StateWAir Force0.5710.572
2020-02-12UNLVLNevada0.4760.548
2020-02-15Air ForceWSan Jose State0.6360.561
2020-02-15Fresno StateLUtah State0.4000.529
2020-02-15New MexicoLUNLV0.5930.505
2020-02-16Boise StateLSan Diego State0.4400.484
2020-02-18New MexicoLNevada0.4550.548
2020-02-18UNLVWColorado State0.5480.525
2020-02-19Utah StateWWyoming0.5830.516
2020-02-19Fresno StateWAir Force0.5330.572
2020-02-22Air ForceLWyoming0.5480.516
2020-02-23Boise StateWNew Mexico0.6000.542
2020-02-25Utah StateWSan Jose State0.4900.561
2020-02-26UNLVWBoise State0.7100.573
2020-02-26Air ForceWNew Mexico0.3710.542
2020-02-29New MexicoWUtah State0.4710.529
2020-02-29Fresno StateWWyoming0.4070.516
Non-Conference Games      2pp =  0.538 +/- 0.105 (Count: 44)
Conference Games          2pp =  0.532 +/- 0.089 (Count: 60)
Difference                2pp = -0.005 +/- 0.020
2pp t-test t-statistic: -0.271, p-value: 0.787

Measure: 3pt Pct

Non-Conference Games

dateteam_nameresultopponent_name3ppOpp Mean 3pt Pct Allowed
2019-11-05San Diego StateWTexas Southern0.3750.342
2019-11-05Utah StateWMontana State0.3330.328
2019-11-05UNLVWPurdue Fort Wayne0.3680.375
2019-11-07Air ForceLIdaho State0.0910.344
2019-11-08Utah StateWWeber State0.3530.362
2019-11-09Air ForceWTexas State0.4620.302
2019-11-09UNLVLKansas State0.2690.366
2019-11-09New MexicoWCSU Northridge0.3750.402
2019-11-10Fresno StateWWinthrop0.4580.322
2019-11-12Utah StateWDenver0.4670.332
2019-11-13San Diego StateWGrand Canyon0.4810.408
2019-11-13New MexicoWGreen Bay0.4090.346
2019-11-15Utah StateWNorth Carolina A&T0.3330.303
2019-11-15Boise StateLUC Irvine0.1900.370
2019-11-16New MexicoWMcNeese0.4000.373
2019-11-18Utah StateWUTSA0.2900.389
2019-11-18UNLVWAbil Christian0.2730.351
2019-11-20Boise StateWBYU0.1580.330
2019-11-20UNLVLTexas State0.3680.302
2019-11-22San Diego StateWLong Island University0.3330.336
2019-11-23UNLVLSMU0.3640.358
2019-11-25San Diego StateWTennessee State0.2860.324
2019-11-26UNLVWJackson State0.4500.369
2019-11-29Boise StateWUNC Wilmington0.2270.371
2019-12-01New MexicoWMontana0.4620.332
2019-12-01Air ForceWJackson State0.4740.369
2019-12-14Boise StateWAlabama State0.5170.388
2019-12-14New MexicoWNew Mexico St0.2500.311
2019-12-17New MexicoWGrand Canyon0.5380.408
2019-12-18UNLVLPacific0.2730.346
2019-12-20Fresno StateWIUPUI0.3850.389
2019-12-21Air ForceLDrake0.5650.383
2019-12-21UNLVWRobert Morris0.2730.336
2019-12-22New MexicoWHouston Baptist0.3160.365
2019-12-23Fresno StateLSan Francisco0.3330.367
2019-12-28Boise StateWCSU Northridge0.4780.402
2019-12-28UNLVWE Michigan0.2350.385
2019-12-28Fresno StateLUC Riverside0.3640.325
2019-12-29New MexicoWUC Davis0.1880.371
2019-12-31Air ForceWUC Riverside0.6520.325
2020-02-01San Diego StateWUtah State0.4380.337
2020-02-11San Diego StateWNew Mexico0.3570.389
2020-02-22San Diego StateLUNLV0.2960.382
2020-02-25San Diego StateWColorado State0.3330.308

Conference Games

dateteam_nameresultopponent_name3ppOpp Mean 3pt Pct Allowed
2019-12-04New MexicoWBoise State0.2140.379
2019-12-04Fresno StateLUNLV0.3330.382
2019-12-07Air ForceLNevada0.3600.349
2019-12-07Utah StateWFresno State0.2110.327
2019-12-07Boise StateWColorado State0.3570.308
2019-12-08San Diego StateWSan José St0.3120.355
2019-12-28San Diego StateWCal Poly0.2220.359
2020-01-01San Diego StateWFresno State0.2500.327
2020-01-01UNLVWUtah State0.2630.337
2020-01-01Boise StateWWyoming0.2000.289
2020-01-04Utah StateLSan Diego State0.2610.286
2020-01-04UNLVWAir Force0.2220.382
2020-01-04Fresno StateWSan Jose State0.4410.355
2020-01-07New MexicoWFresno State0.4090.327
2020-01-07Air ForceWUtah State0.3200.337
2020-01-08Boise StateWUNLV0.4210.382
2020-01-11Utah StateWNevada0.2920.349
2020-01-11New MexicoWAir Force0.3530.382
2020-01-11San Diego StateWBoise State0.4740.379
2020-01-14Fresno StateLSan Diego State0.2940.286
2020-01-15UNLVWSan Jose State0.4000.355
2020-01-15Air ForceWBoise State0.3120.379
2020-01-18UNLVWNew Mexico0.3080.389
2020-01-18Boise StateWUtah State0.3750.337
2020-01-18San Diego StateWNevada0.3700.349
2020-01-18Air ForceLColorado State0.2500.308
2020-01-21Utah StateWAir Force0.3210.382
2020-01-21San Diego StateWWyoming0.4500.289
2020-01-21New MexicoWSan Jose State0.3120.355
2020-01-25Fresno StateLBoise State0.2500.379
2020-01-25Utah StateWColorado State0.4380.308
2020-01-26UNLVLSan Diego State0.3080.286
2020-01-28Air ForceLFresno State0.3790.327
2020-01-29Boise StateWSan Jose State0.5770.355
2020-01-29New MexicoLSan Diego State0.1740.286
2020-02-01Fresno StateWNew Mexico0.4400.389
2020-02-01Boise StateWNevada0.3450.349
2020-02-04Fresno StateLColorado State0.2960.308
2020-02-05Utah StateWUNLV0.3750.382
2020-02-08Utah StateWBoise State0.1050.379
2020-02-08Air ForceLSan Diego State0.4000.286
2020-02-08UNLVWFresno State0.3330.327
2020-02-08New MexicoWWyoming0.4140.289
2020-02-11Boise StateWAir Force0.2410.382
2020-02-12UNLVLNevada0.2310.349
2020-02-15Air ForceWSan Jose State0.3680.355
2020-02-15Fresno StateLUtah State0.3640.337
2020-02-15New MexicoLUNLV0.2610.382
2020-02-16Boise StateLSan Diego State0.3850.286
2020-02-18New MexicoLNevada0.3240.349
2020-02-18UNLVWColorado State0.4170.308
2020-02-19Utah StateWWyoming0.3500.289
2020-02-19Fresno StateWAir Force0.3330.382
2020-02-22Air ForceLWyoming0.2140.289
2020-02-23Boise StateWNew Mexico0.2900.389
2020-02-25Utah StateWSan Jose State0.4760.355
2020-02-26UNLVWBoise State0.2500.379
2020-02-26Air ForceWNew Mexico0.4000.389
2020-02-29New MexicoWUtah State0.4170.337
2020-02-29Fresno StateWWyoming0.3640.289
Non-Conference Games      3pp =  0.360 +/- 0.112 (Count: 44)
Conference Games          3pp =  0.330 +/- 0.086 (Count: 60)
Difference                3pp = -0.030 +/- 0.020
3pp t-test t-statistic: -1.446, p-value: 0.152

Measure: EFG

Non-Conference Games

dateteam_nameresultopponent_nameefgOpp Mean EFG Allowed
2019-11-05San Diego StateWTexas Southern0.4510.521
2019-11-05Utah StateWMontana State0.4340.494
2019-11-05UNLVWPurdue Fort Wayne0.5830.557
2019-11-07Air ForceLIdaho State0.5290.562
2019-11-08Utah StateWWeber State0.5970.545
2019-11-09Air ForceWTexas State0.5830.471
2019-11-09UNLVLKansas State0.4050.543
2019-11-09New MexicoWCSU Northridge0.6500.550
2019-11-10Fresno StateWWinthrop0.5870.502
2019-11-12Utah StateWDenver0.5820.534
2019-11-13San Diego StateWGrand Canyon0.6480.536
2019-11-13New MexicoWGreen Bay0.5460.522
2019-11-15Utah StateWNorth Carolina A&T0.6060.511
2019-11-15Boise StateLUC Irvine0.3450.477
2019-11-16New MexicoWMcNeese0.5420.515
2019-11-18Utah StateWUTSA0.5270.557
2019-11-18UNLVWAbil Christian0.6000.534
2019-11-20Boise StateWBYU0.4340.546
2019-11-20UNLVLTexas State0.4180.471
2019-11-22San Diego StateWLong Island University0.5520.496
2019-11-23UNLVLSMU0.4720.531
2019-11-25San Diego StateWTennessee State0.4110.491
2019-11-26UNLVWJackson State0.6520.510
2019-11-29Boise StateWUNC Wilmington0.5330.545
2019-12-01New MexicoWMontana0.4900.502
2019-12-01Air ForceWJackson State0.6930.510
2019-12-14Boise StateWAlabama State0.7130.536
2019-12-14New MexicoWNew Mexico St0.4600.514
2019-12-17New MexicoWGrand Canyon0.6790.536
2019-12-18UNLVLPacific0.5000.473
2019-12-20Fresno StateWIUPUI0.5560.542
2019-12-21Air ForceLDrake0.6840.512
2019-12-21UNLVWRobert Morris0.5800.528
2019-12-22New MexicoWHouston Baptist0.6880.559
2019-12-23Fresno StateLSan Francisco0.5250.521
2019-12-28Boise StateWCSU Northridge0.6590.550
2019-12-28UNLVWE Michigan0.4140.514
2019-12-28Fresno StateLUC Riverside0.5000.466
2019-12-29New MexicoWUC Davis0.4640.560
2019-12-31Air ForceWUC Riverside0.7410.466
2020-02-01San Diego StateWUtah State0.6150.514
2020-02-11San Diego StateWNew Mexico0.5310.560
2020-02-22San Diego StateLUNLV0.4630.536
2020-02-25San Diego StateWColorado State0.4540.499

Conference Games

dateteam_nameresultopponent_nameefgOpp Mean EFG Allowed
2019-12-04New MexicoWBoise State0.5350.568
2019-12-04Fresno StateLUNLV0.4920.536
2019-12-07Air ForceLNevada0.5360.535
2019-12-07Utah StateWFresno State0.3830.466
2019-12-07Boise StateWColorado State0.5160.499
2019-12-08San Diego StateWSan José St0.3570.555
2019-12-28San Diego StateWCal Poly0.4670.517
2020-01-01San Diego StateWFresno State0.4800.466
2020-01-01UNLVWUtah State0.4910.514
2020-01-01Boise StateWWyoming0.4220.481
2020-01-04Utah StateLSan Diego State0.4810.459
2020-01-04UNLVWAir Force0.5190.575
2020-01-04Fresno StateWSan Jose State0.6050.555
2020-01-07New MexicoWFresno State0.5430.466
2020-01-07Air ForceWUtah State0.5410.514
2020-01-08Boise StateWUNLV0.5000.536
2020-01-11Utah StateWNevada0.5280.535
2020-01-11New MexicoWAir Force0.6350.575
2020-01-11San Diego StateWBoise State0.6020.568
2020-01-14Fresno StateLSan Diego State0.4090.459
2020-01-15UNLVWSan Jose State0.6250.555
2020-01-15Air ForceWBoise State0.5460.568
2020-01-18UNLVWNew Mexico0.5600.560
2020-01-18Boise StateWUtah State0.5450.514
2020-01-18San Diego StateWNevada0.4670.535
2020-01-18Air ForceLColorado State0.4720.499
2020-01-21Utah StateWAir Force0.4840.575
2020-01-21San Diego StateWWyoming0.6410.481
2020-01-21New MexicoWSan Jose State0.6130.555
2020-01-25Fresno StateLBoise State0.4190.568
2020-01-25Utah StateWColorado State0.6630.499
2020-01-26UNLVLSan Diego State0.5090.459
2020-01-28Air ForceLFresno State0.5000.466
2020-01-29Boise StateWSan Jose State0.7160.555
2020-01-29New MexicoLSan Diego State0.3690.459
2020-02-01Fresno StateWNew Mexico0.6850.560
2020-02-01Boise StateWNevada0.5190.535
2020-02-04Fresno StateLColorado State0.5080.499
2020-02-05Utah StateWUNLV0.5620.536
2020-02-08Utah StateWBoise State0.4000.568
2020-02-08Air ForceLSan Diego State0.5360.459
2020-02-08UNLVWFresno State0.4660.466
2020-02-08New MexicoWWyoming0.5970.481
2020-02-11Boise StateWAir Force0.4770.575
2020-02-12UNLVLNevada0.4140.535
2020-02-15Air ForceWSan Jose State0.6110.555
2020-02-15Fresno StateLUtah State0.4910.514
2020-02-15New MexicoLUNLV0.5000.536
2020-02-16Boise StateLSan Diego State0.5100.459
2020-02-18New MexicoLNevada0.4700.535
2020-02-18UNLVWColorado State0.5760.499
2020-02-19Utah StateWWyoming0.5620.481
2020-02-19Fresno StateWAir Force0.5170.575
2020-02-22Air ForceLWyoming0.4910.481
2020-02-23Boise StateWNew Mexico0.5160.560
2020-02-25Utah StateWSan Jose State0.5560.555
2020-02-26UNLVWBoise State0.5640.568
2020-02-26Air ForceWNew Mexico0.4670.560
2020-02-29New MexicoWUtah State0.5340.514
2020-02-29Fresno StateWWyoming0.4690.481
Non-Conference Games      efg =  0.548 +/- 0.095 (Count: 44)
Conference Games          efg =  0.519 +/- 0.074 (Count: 60)
Difference                efg = -0.028 +/- 0.017
efg t-test t-statistic: -1.615, p-value: 0.110

Measure: Adjusted Turnover Pct

Non-Conference Games

dateteam_nameresultopponent_nameadj_tovOpp Mean TO Pct Forced
2019-11-05San Diego StateWTexas Southern-0.0190.182
2019-11-05Utah StateWMontana State-0.1880.147
2019-11-05UNLVWPurdue Fort Wayne0.1480.169
2019-11-07Air ForceLIdaho State0.1320.162
2019-11-08Utah StateWWeber State-0.3820.165
2019-11-09Air ForceWTexas State-0.0400.184
2019-11-09UNLVLKansas State0.4900.215
2019-11-09New MexicoWCSU Northridge-0.0730.167
2019-11-10Fresno StateWWinthrop0.1810.176
2019-11-12Utah StateWDenver-0.0320.160
2019-11-13San Diego StateWGrand Canyon-0.2020.132
2019-11-13New MexicoWGreen Bay0.1330.182
2019-11-15Utah StateWNorth Carolina A&T0.1710.177
2019-11-15Boise StateLUC Irvine0.1070.155
2019-11-16New MexicoWMcNeese0.1330.171
2019-11-18Utah StateWUTSA0.3800.154
2019-11-18UNLVWAbil Christian-0.2050.243
2019-11-20Boise StateWBYU-0.2860.178
2019-11-20UNLVLTexas State0.2050.184
2019-11-22San Diego StateWLong Island University-0.5040.169
2019-11-23UNLVLSMU-0.1760.166
2019-11-25San Diego StateWTennessee State0.1130.143
2019-11-26UNLVWJackson State0.2080.228
2019-11-29Boise StateWUNC Wilmington-0.3790.154
2019-12-01New MexicoWMontana-0.3070.189
2019-12-01Air ForceWJackson State0.1190.228
2019-12-14Boise StateWAlabama State-0.0790.178
2019-12-14New MexicoWNew Mexico St0.1820.193
2019-12-17New MexicoWGrand Canyon0.7370.132
2019-12-18UNLVLPacific0.2990.170
2019-12-20Fresno StateWIUPUI-0.1100.160
2019-12-21Air ForceLDrake0.3350.161
2019-12-21UNLVWRobert Morris-0.1150.201
2019-12-22New MexicoWHouston Baptist-0.2310.164
2019-12-23Fresno StateLSan Francisco0.1740.186
2019-12-28Boise StateWCSU Northridge0.0050.167
2019-12-28UNLVWE Michigan0.3260.208
2019-12-28Fresno StateLUC Riverside0.3430.162
2019-12-29New MexicoWUC Davis0.5420.182
2019-12-31Air ForceWUC Riverside-0.4640.162
2020-02-01San Diego StateWUtah State-0.2450.168
2020-02-11San Diego StateWNew Mexico0.1110.182
2020-02-22San Diego StateLUNLV0.2910.141
2020-02-25San Diego StateWColorado State0.1540.152

Conference Games

dateteam_nameresultopponent_nameadj_tovOpp Mean TO Pct Forced
2019-12-04New MexicoWBoise State-0.5560.205
2019-12-04Fresno StateLUNLV-0.2250.141
2019-12-07Air ForceLNevada-0.1850.145
2019-12-07Utah StateWFresno State-0.0750.142
2019-12-07Boise StateWColorado State-0.1060.152
2019-12-08San Diego StateWSan José St-0.2350.160
2019-12-28San Diego StateWCal Poly-0.1090.161
2020-01-01San Diego StateWFresno State0.5400.142
2020-01-01UNLVWUtah State0.2440.168
2020-01-01Boise StateWWyoming0.1010.186
2020-01-04Utah StateLSan Diego State-0.0630.172
2020-01-04UNLVWAir Force-0.1630.161
2020-01-04Fresno StateWSan Jose State-0.2060.160
2020-01-07New MexicoWFresno State-0.1830.142
2020-01-07Air ForceWUtah State0.0340.168
2020-01-08Boise StateWUNLV0.2230.141
2020-01-11Utah StateWNevada0.2590.145
2020-01-11New MexicoWAir Force0.5360.161
2020-01-11San Diego StateWBoise State-0.3790.205
2020-01-14Fresno StateLSan Diego State0.0300.172
2020-01-15UNLVWSan Jose State0.2900.160
2020-01-15Air ForceWBoise State-0.5280.205
2020-01-18UNLVWNew Mexico-0.3100.182
2020-01-18Boise StateWUtah State0.0740.168
2020-01-18San Diego StateWNevada0.1810.145
2020-01-18Air ForceLColorado State0.3620.152
2020-01-21Utah StateWAir Force-0.0940.161
2020-01-21San Diego StateWWyoming-0.1200.186
2020-01-21New MexicoWSan Jose State-0.2100.160
2020-01-25Fresno StateLBoise State0.3290.205
2020-01-25Utah StateWColorado State0.4060.152
2020-01-26UNLVLSan Diego State-0.1810.172
2020-01-28Air ForceLFresno State-0.1020.142
2020-01-29Boise StateWSan Jose State-0.0750.160
2020-01-29New MexicoLSan Diego State-0.1450.172
2020-02-01Fresno StateWNew Mexico0.3020.182
2020-02-01Boise StateWNevada0.0640.145
2020-02-04Fresno StateLColorado State0.1490.152
2020-02-05Utah StateWUNLV0.3220.141
2020-02-08Utah StateWBoise State-0.1350.205
2020-02-08Air ForceLSan Diego State-0.2710.172
2020-02-08UNLVWFresno State-0.2530.142
2020-02-08New MexicoWWyoming-0.1930.186
2020-02-11Boise StateWAir Force-0.2910.161
2020-02-12UNLVLNevada-0.4240.145
2020-02-15Air ForceWSan Jose State0.0080.160
2020-02-15Fresno StateLUtah State-0.1390.168
2020-02-15New MexicoLUNLV0.2290.141
2020-02-16Boise StateLSan Diego State0.4250.172
2020-02-18New MexicoLNevada0.0230.145
2020-02-18UNLVWColorado State0.0300.152
2020-02-19Utah StateWWyoming0.1940.186
2020-02-19Fresno StateWAir Force0.0810.161
2020-02-22Air ForceLWyoming-0.0200.186
2020-02-23Boise StateWNew Mexico0.1730.182
2020-02-25Utah StateWSan Jose State0.0050.160
2020-02-26UNLVWBoise State-0.3210.205
2020-02-26Air ForceWNew Mexico0.2990.182
2020-02-29New MexicoWUtah State-0.0200.168
2020-02-29Fresno StateWWyoming0.0020.186
Non-Conference Games  adj_tov =  0.045 +/- 0.271 (Count: 44)
Conference Games      adj_tov = -0.007 +/- 0.249 (Count: 60)
Difference            adj_tov = -0.052 +/- 0.052
adj_tov t-test t-statistic: -0.986, p-value: 0.327

Measure: Adjusted 2pt Pct

Non-Conference Games

dateteam_nameresultopponent_nameadj_2ppOpp Mean 2pt Pct Allowed
2019-11-05San Diego StateWTexas Southern-0.2390.520
2019-11-05Utah StateWMontana State-0.1880.493
2019-11-05UNLVWPurdue Fort Wayne0.0950.548
2019-11-07Air ForceLIdaho State0.1000.576
2019-11-08Utah StateWWeber State0.1600.534
2019-11-09Air ForceWTexas State-0.0500.478
2019-11-09UNLVLKansas State-0.2430.536
2019-11-09New MexicoWCSU Northridge0.3230.515
2019-11-10Fresno StateWWinthrop-0.0260.513
2019-11-12Utah StateWDenver-0.1320.561
2019-11-13San Diego StateWGrand Canyon0.2430.478
2019-11-13New MexicoWGreen Bay-0.0190.522
2019-11-15Utah StateWNorth Carolina A&T0.2230.530
2019-11-15Boise StateLUC Irvine-0.1320.441
2019-11-16New MexicoWMcNeese0.0730.478
2019-11-18Utah StateWUTSA0.1130.535
2019-11-18UNLVWAbil Christian0.4030.535
2019-11-20Boise StateWBYU-0.0760.567
2019-11-20UNLVLTexas State-0.3030.478
2019-11-22San Diego StateWLong Island University0.2260.485
2019-11-23UNLVLSMU-0.3300.523
2019-11-25San Diego StateWTennessee State-0.1790.487
2019-11-26UNLVWJackson State0.3350.479
2019-11-29Boise StateWUNC Wilmington0.2070.531
2019-12-01New MexicoWMontana-0.1670.506
2019-12-01Air ForceWJackson State0.4210.479
2019-12-14Boise StateWAlabama State0.2880.510
2019-12-14New MexicoWNew Mexico St-0.0760.541
2019-12-17New MexicoWGrand Canyon0.1840.478
2019-12-18UNLVLPacific0.2820.450
2019-12-20Fresno StateWIUPUI0.0500.506
2019-12-21Air ForceLDrake0.1390.473
2019-12-21UNLVWRobert Morris0.1480.542
2019-12-22New MexicoWHouston Baptist0.3830.562
2019-12-23Fresno StateLSan Francisco0.0650.512
2019-12-28Boise StateWCSU Northridge0.2130.515
2019-12-28UNLVWE Michigan-0.0290.452
2019-12-28Fresno StateLUC Riverside0.0160.454
2019-12-29New MexicoWUC Davis-0.0320.556
2019-12-31Air ForceWUC Riverside0.2680.454
2020-02-01San Diego StateWUtah State0.0400.529
2020-02-11San Diego StateWNew Mexico-0.0270.542
2020-02-22San Diego StateLUNLV-0.0460.505
2020-02-25San Diego StateWColorado State-0.2740.525

Conference Games

dateteam_nameresultopponent_nameadj_2ppOpp Mean 2pt Pct Allowed
2019-12-04New MexicoWBoise State0.0560.573
2019-12-04Fresno StateLUNLV-0.0610.505
2019-12-07Air ForceLNevada-0.0270.548
2019-12-07Utah StateWFresno State-0.0840.453
2019-12-07Boise StateWColorado State-0.0480.525
2019-12-08San Diego StateWSan José St-0.4310.561
2019-12-28San Diego StateWCal Poly0.1470.502
2020-01-01San Diego StateWFresno State0.1340.453
2020-01-01UNLVWUtah State0.0220.529
2020-01-01Boise StateWWyoming-0.0850.516
2020-01-04Utah StateLSan Diego State0.1330.484
2020-01-04UNLVWAir Force0.2590.572
2020-01-04Fresno StateWSan Jose State-0.0700.561
2020-01-07New MexicoWFresno State0.1040.453
2020-01-07Air ForceWUtah State0.1030.529
2020-01-08Boise StateWUNLV-0.1690.505
2020-01-11Utah StateWNevada0.0950.548
2020-01-11New MexicoWAir Force0.1990.572
2020-01-11San Diego StateWBoise State-0.0400.573
2020-01-14Fresno StateLSan Diego State-0.1840.484
2020-01-15UNLVWSan Jose State0.1390.561
2020-01-15Air ForceWBoise State0.0110.573
2020-01-18UNLVWNew Mexico0.1290.542
2020-01-18Boise StateWUtah State0.0040.529
2020-01-18San Diego StateWNevada-0.2810.548
2020-01-18Air ForceLColorado State0.0510.525
2020-01-21Utah StateWAir Force-0.1530.572
2020-01-21San Diego StateWWyoming0.1930.516
2020-01-21New MexicoWSan Jose State0.2040.561
2020-01-25Fresno StateLBoise State-0.2240.573
2020-01-25Utah StateWColorado State0.2700.525
2020-01-26UNLVLSan Diego State0.1400.484
2020-01-28Air ForceLFresno State-0.0430.453
2020-01-29Boise StateWSan Jose State0.0580.561
2020-01-29New MexicoLSan Diego State-0.1140.484
2020-02-01Fresno StateWNew Mexico0.3170.542
2020-02-01Boise StateWNevada-0.0480.548
2020-02-04Fresno StateLColorado State0.0640.525
2020-02-05Utah StateWUNLV0.1150.505
2020-02-08Utah StateWBoise State-0.0420.573
2020-02-08Air ForceLSan Diego State0.0330.484
2020-02-08UNLVWFresno State-0.0260.453
2020-02-08New MexicoWWyoming0.1220.516
2020-02-11Boise StateWAir Force-0.0010.572
2020-02-12UNLVLNevada-0.1310.548
2020-02-15Air ForceWSan Jose State0.1340.561
2020-02-15Fresno StateLUtah State-0.2440.529
2020-02-15New MexicoLUNLV0.1740.505
2020-02-16Boise StateLSan Diego State-0.0910.484
2020-02-18New MexicoLNevada-0.1700.548
2020-02-18UNLVWColorado State0.0430.525
2020-02-19Utah StateWWyoming0.1310.516
2020-02-19Fresno StateWAir Force-0.0680.572
2020-02-22Air ForceLWyoming0.0610.516
2020-02-23Boise StateWNew Mexico0.1060.542
2020-02-25Utah StateWSan Jose State-0.1260.561
2020-02-26UNLVWBoise State0.2390.573
2020-02-26Air ForceWNew Mexico-0.3150.542
2020-02-29New MexicoWUtah State-0.1100.529
2020-02-29Fresno StateWWyoming-0.2100.516
Non-Conference Games  adj_2pp =  0.055 +/- 0.199 (Count: 44)
Conference Games      adj_2pp =  0.007 +/- 0.154 (Count: 60)
Difference            adj_2pp = -0.049 +/- 0.036
adj_2pp t-test t-statistic: -1.337, p-value: 0.185

Measure: Adjusted 3pt Pct

Non-Conference Games

dateteam_nameresultopponent_nameadj_3ppOpp Mean 3pt Pct Allowed
2019-11-05San Diego StateWTexas Southern0.0960.342
2019-11-05Utah StateWMontana State0.0150.328
2019-11-05UNLVWPurdue Fort Wayne-0.0180.375
2019-11-07Air ForceLIdaho State-0.7360.344
2019-11-08Utah StateWWeber State-0.0260.362
2019-11-09Air ForceWTexas State0.5290.302
2019-11-09UNLVLKansas State-0.2630.366
2019-11-09New MexicoWCSU Northridge-0.0660.402
2019-11-10Fresno StateWWinthrop0.4250.322
2019-11-12Utah StateWDenver0.4040.332
2019-11-13San Diego StateWGrand Canyon0.1800.408
2019-11-13New MexicoWGreen Bay0.1810.346
2019-11-15Utah StateWNorth Carolina A&T0.0990.303
2019-11-15Boise StateLUC Irvine-0.4860.370
2019-11-16New MexicoWMcNeese0.0720.373
2019-11-18Utah StateWUTSA-0.2530.389
2019-11-18UNLVWAbil Christian-0.2230.351
2019-11-20Boise StateWBYU-0.5210.330
2019-11-20UNLVLTexas State0.2200.302
2019-11-22San Diego StateWLong Island University-0.0090.336
2019-11-23UNLVLSMU0.0150.358
2019-11-25San Diego StateWTennessee State-0.1180.324
2019-11-26UNLVWJackson State0.2190.369
2019-11-29Boise StateWUNC Wilmington-0.3870.371
2019-12-01New MexicoWMontana0.3900.332
2019-12-01Air ForceWJackson State0.2830.369
2019-12-14Boise StateWAlabama State0.3340.388
2019-12-14New MexicoWNew Mexico St-0.1950.311
2019-12-17New MexicoWGrand Canyon0.3200.408
2019-12-18UNLVLPacific-0.2120.346
2019-12-20Fresno StateWIUPUI-0.0120.389
2019-12-21Air ForceLDrake0.4740.383
2019-12-21UNLVWRobert Morris-0.1890.336
2019-12-22New MexicoWHouston Baptist-0.1350.365
2019-12-23Fresno StateLSan Francisco-0.0910.367
2019-12-28Boise StateWCSU Northridge0.1910.402
2019-12-28UNLVWE Michigan-0.3880.385
2019-12-28Fresno StateLUC Riverside0.1190.325
2019-12-29New MexicoWUC Davis-0.4950.371
2019-12-31Air ForceWUC Riverside1.0070.325
2020-02-01San Diego StateWUtah State0.2980.337
2020-02-11San Diego StateWNew Mexico-0.0820.389
2020-02-22San Diego StateLUNLV-0.2240.382
2020-02-25San Diego StateWColorado State0.0830.308

Conference Games

dateteam_nameresultopponent_nameadj_3ppOpp Mean 3pt Pct Allowed
2019-12-04New MexicoWBoise State-0.4350.379
2019-12-04Fresno StateLUNLV-0.1270.382
2019-12-07Air ForceLNevada0.0320.349
2019-12-07Utah StateWFresno State-0.3560.327
2019-12-07Boise StateWColorado State0.1610.308
2019-12-08San Diego StateWSan José St-0.1190.355
2019-12-28San Diego StateWCal Poly-0.3800.359
2020-01-01San Diego StateWFresno State-0.2360.327
2020-01-01UNLVWUtah State-0.2190.337
2020-01-01Boise StateWWyoming-0.3080.289
2020-01-04Utah StateLSan Diego State-0.0870.286
2020-01-04UNLVWAir Force-0.4190.382
2020-01-04Fresno StateWSan Jose State0.2430.355
2020-01-07New MexicoWFresno State0.2510.327
2020-01-07Air ForceWUtah State-0.0500.337
2020-01-08Boise StateWUNLV0.1030.382
2020-01-11Utah StateWNevada-0.1640.349
2020-01-11New MexicoWAir Force-0.0770.382
2020-01-11San Diego StateWBoise State0.2500.379
2020-01-14Fresno StateLSan Diego State0.0290.286
2020-01-15UNLVWSan Jose State0.1270.355
2020-01-15Air ForceWBoise State-0.1760.379
2020-01-18UNLVWNew Mexico-0.2090.389
2020-01-18Boise StateWUtah State0.1130.337
2020-01-18San Diego StateWNevada0.0610.349
2020-01-18Air ForceLColorado State-0.1880.308
2020-01-21Utah StateWAir Force-0.1590.382
2020-01-21San Diego StateWWyoming0.5570.289
2020-01-21New MexicoWSan Jose State-0.1190.355
2020-01-25Fresno StateLBoise State-0.3400.379
2020-01-25Utah StateWColorado State0.4220.308
2020-01-26UNLVLSan Diego State0.0770.286
2020-01-28Air ForceLFresno State0.1600.327
2020-01-29Boise StateWSan Jose State0.6260.355
2020-01-29New MexicoLSan Diego State-0.3910.286
2020-02-01Fresno StateWNew Mexico0.1310.389
2020-02-01Boise StateWNevada-0.0120.349
2020-02-04Fresno StateLColorado State-0.0370.308
2020-02-05Utah StateWUNLV-0.0180.382
2020-02-08Utah StateWBoise State-0.7220.379
2020-02-08Air ForceLSan Diego State0.4000.286
2020-02-08UNLVWFresno State0.0190.327
2020-02-08New MexicoWWyoming0.4320.289
2020-02-11Boise StateWAir Force-0.3680.382
2020-02-12UNLVLNevada-0.3390.349
2020-02-15Air ForceWSan Jose State0.0380.355
2020-02-15Fresno StateLUtah State0.0790.337
2020-02-15New MexicoLUNLV-0.3170.382
2020-02-16Boise StateLSan Diego State0.3460.286
2020-02-18New MexicoLNevada-0.0730.349
2020-02-18UNLVWColorado State0.3540.308
2020-02-19Utah StateWWyoming0.2110.289
2020-02-19Fresno StateWAir Force-0.1280.382
2020-02-22Air ForceLWyoming-0.2590.289
2020-02-23Boise StateWNew Mexico-0.2540.389
2020-02-25Utah StateWSan Jose State0.3420.355
2020-02-26UNLVWBoise State-0.3400.379
2020-02-26Air ForceWNew Mexico0.0280.389
2020-02-29New MexicoWUtah State0.2370.337
2020-02-29Fresno StateWWyoming0.2580.289
Non-Conference Games  adj_3pp =  0.019 +/- 0.324 (Count: 44)
Conference Games      adj_3pp = -0.022 +/- 0.274 (Count: 60)
Difference            adj_3pp = -0.041 +/- 0.060
adj_3pp t-test t-statistic: -0.674, p-value: 0.502

Measure: Adjusted EFG

Non-Conference Games

dateteam_nameresultopponent_nameadj_efgOpp Mean EFG Allowed
2019-11-05San Diego StateWTexas Southern-0.1340.521
2019-11-05Utah StateWMontana State-0.1220.494
2019-11-05UNLVWPurdue Fort Wayne0.0470.557
2019-11-07Air ForceLIdaho State-0.0590.562
2019-11-08Utah StateWWeber State0.0960.545
2019-11-09Air ForceWTexas State0.2380.471
2019-11-09UNLVLKansas State-0.2530.543
2019-11-09New MexicoWCSU Northridge0.1830.550
2019-11-10Fresno StateWWinthrop0.1680.502
2019-11-12Utah StateWDenver0.0890.534
2019-11-13San Diego StateWGrand Canyon0.2100.536
2019-11-13New MexicoWGreen Bay0.0460.522
2019-11-15Utah StateWNorth Carolina A&T0.1860.511
2019-11-15Boise StateLUC Irvine-0.2760.477
2019-11-16New MexicoWMcNeese0.0530.515
2019-11-18Utah StateWUTSA-0.0530.557
2019-11-18UNLVWAbil Christian0.1240.534
2019-11-20Boise StateWBYU-0.2040.546
2019-11-20UNLVLTexas State-0.1120.471
2019-11-22San Diego StateWLong Island University0.1140.496
2019-11-23UNLVLSMU-0.1120.531
2019-11-25San Diego StateWTennessee State-0.1640.491
2019-11-26UNLVWJackson State0.2790.510
2019-11-29Boise StateWUNC Wilmington-0.0230.545
2019-12-01New MexicoWMontana-0.0230.502
2019-12-01Air ForceWJackson State0.3600.510
2019-12-14Boise StateWAlabama State0.3290.536
2019-12-14New MexicoWNew Mexico St-0.1050.514
2019-12-17New MexicoWGrand Canyon0.2660.536
2019-12-18UNLVLPacific0.0570.473
2019-12-20Fresno StateWIUPUI0.0270.542
2019-12-21Air ForceLDrake0.3350.512
2019-12-21UNLVWRobert Morris0.0980.528
2019-12-22New MexicoWHouston Baptist0.2300.559
2019-12-23Fresno StateLSan Francisco0.0070.521
2019-12-28Boise StateWCSU Northridge0.1980.550
2019-12-28UNLVWE Michigan-0.1950.514
2019-12-28Fresno StateLUC Riverside0.0740.466
2019-12-29New MexicoWUC Davis-0.1720.560
2019-12-31Air ForceWUC Riverside0.5920.466
2020-02-01San Diego StateWUtah State0.1970.514
2020-02-11San Diego StateWNew Mexico-0.0510.560
2020-02-22San Diego StateLUNLV-0.1370.536
2020-02-25San Diego StateWColorado State-0.0910.499

Conference Games

dateteam_nameresultopponent_nameadj_efgOpp Mean EFG Allowed
2019-12-04New MexicoWBoise State-0.0580.568
2019-12-04Fresno StateLUNLV-0.0830.536
2019-12-07Air ForceLNevada0.0030.535
2019-12-07Utah StateWFresno State-0.1780.466
2019-12-07Boise StateWColorado State0.0340.499
2019-12-08San Diego StateWSan José St-0.3570.555
2019-12-28San Diego StateWCal Poly-0.0970.517
2020-01-01San Diego StateWFresno State0.0280.466
2020-01-01UNLVWUtah State-0.0440.514
2020-01-01Boise StateWWyoming-0.1230.481
2020-01-04Utah StateLSan Diego State0.0500.459
2020-01-04UNLVWAir Force-0.0960.575
2020-01-04Fresno StateWSan Jose State0.0900.555
2020-01-07New MexicoWFresno State0.1650.466
2020-01-07Air ForceWUtah State0.0530.514
2020-01-08Boise StateWUNLV-0.0680.536
2020-01-11Utah StateWNevada-0.0130.535
2020-01-11New MexicoWAir Force0.1040.575
2020-01-11San Diego StateWBoise State0.0590.568
2020-01-14Fresno StateLSan Diego State-0.1080.459
2020-01-15UNLVWSan Jose State0.1260.555
2020-01-15Air ForceWBoise State-0.0380.568
2020-01-18UNLVWNew Mexico0.0000.560
2020-01-18Boise StateWUtah State0.0600.514
2020-01-18San Diego StateWNevada-0.1280.535
2020-01-18Air ForceLColorado State-0.0550.499
2020-01-21Utah StateWAir Force-0.1580.575
2020-01-21San Diego StateWWyoming0.3340.481
2020-01-21New MexicoWSan Jose State0.1050.555
2020-01-25Fresno StateLBoise State-0.2630.568
2020-01-25Utah StateWColorado State0.3280.499
2020-01-26UNLVLSan Diego State0.1100.459
2020-01-28Air ForceLFresno State0.0720.466
2020-01-29Boise StateWSan Jose State0.2890.555
2020-01-29New MexicoLSan Diego State-0.1950.459
2020-02-01Fresno StateWNew Mexico0.2230.560
2020-02-01Boise StateWNevada-0.0290.535
2020-02-04Fresno StateLColorado State0.0180.499
2020-02-05Utah StateWUNLV0.0490.536
2020-02-08Utah StateWBoise State-0.2960.568
2020-02-08Air ForceLSan Diego State0.1680.459
2020-02-08UNLVWFresno State-0.0020.466
2020-02-08New MexicoWWyoming0.2420.481
2020-02-11Boise StateWAir Force-0.1710.575
2020-02-12UNLVLNevada-0.2270.535
2020-02-15Air ForceWSan Jose State0.1010.555
2020-02-15Fresno StateLUtah State-0.0450.514
2020-02-15New MexicoLUNLV-0.0680.536
2020-02-16Boise StateLSan Diego State0.1110.459
2020-02-18New MexicoLNevada-0.1210.535
2020-02-18UNLVWColorado State0.1530.499
2020-02-19Utah StateWWyoming0.1700.481
2020-02-19Fresno StateWAir Force-0.1010.575
2020-02-22Air ForceLWyoming0.0210.481
2020-02-23Boise StateWNew Mexico-0.0770.560
2020-02-25Utah StateWSan Jose State0.0010.555
2020-02-26UNLVWBoise State-0.0080.568
2020-02-26Air ForceWNew Mexico-0.1660.560
2020-02-29New MexicoWUtah State0.0400.514
2020-02-29Fresno StateWWyoming-0.0240.481
Non-Conference Games  adj_efg =  0.053 +/- 0.185 (Count: 44)
Conference Games      adj_efg = -0.002 +/- 0.143 (Count: 60)
Difference            adj_efg = -0.054 +/- 0.034
adj_efg t-test t-statistic: -1.600, p-value: 0.114

Nike School Home Game Stats Summary

MetricNon-Conf MeanConf Meanp-valueSignificant
tov_pct0.1820.1630.058
2pp0.5380.5320.787
3pp0.3600.3300.152
efg0.5480.5190.110
adj_tov0.045-0.0070.327
adj_2pp0.0550.0070.185
adj_3pp0.019-0.0220.502
adj_efg0.053-0.0020.114

Current 2019-2020 D1 Stat Distributions

w Nike Ball

All Players, MWC Split Stats

Air Force Player Split Stats (EFG)
               Player                  Other Ball       Nike ShotTracker Ball
             S. Tomes                        0.38                        0.53
           L. Scottie                        0.49                        0.50
             L. Brown                        0.39                        0.44
              R. Swan                        0.61                        0.56
             C. Joyce                        0.60                        0.45
        K. Van Soelen                        0.47                        0.50
          A.J. Walker                        0.58                        0.47
           A. Kinrade                        0.60                        0.57
            I. Monson                        0.69                        0.00
            C. Morris                        0.71                        0.48
            M. Taylor                        0.79                        0.41
            C. Murphy                        1.33                        0.00
      S. Pierre-Louis                        1.00                        0.00
           N. Jackson                        0.70                        0.25
      C. Vander Zwaag                        0.75                        1.00
             A. Akaya                        0.62                        0.53
             C. Zwaag                        0.00                        0.00
            K. Soelen                        0.00                        1.00
 Air Force Player Split Stats (FT Pct)
               Player                  Other Ball       Nike ShotTracker Ball
             S. Tomes                28-33 (0.85)                32-38 (0.84)
           L. Scottie                40-60 (0.67)                45-69 (0.65)
             L. Brown                  5-7 (0.71)                  1-2 (0.50)
              R. Swan                45-62 (0.73)                34-50 (0.68)
             C. Joyce                22-29 (0.76)                12-16 (0.75)
        K. Van Soelen                22-28 (0.79)                12-20 (0.60)
          A.J. Walker                38-52 (0.73)                22-28 (0.79)
           A. Kinrade                17-19 (0.89)                  2-2 (1.00)
            I. Monson                  4-4 (1.00)                  3-4 (0.75)
            C. Morris                26-33 (0.79)                19-29 (0.66)
            M. Taylor                  5-7 (0.71)                  1-3 (0.33)
            C. Murphy                  4-4 (1.00)                  3-4 (0.75)
      S. Pierre-Louis                  0-0 (0.00)                  0-0 (0.00)
           N. Jackson                 5-10 (0.50)                  0-0 (0.00)
      C. Vander Zwaag                  0-0 (0.00)                  0-0 (0.00)
             A. Akaya                  5-6 (0.83)                  6-6 (1.00)
             C. Zwaag                  0-0 (0.00)                  1-2 (0.50)
            K. Soelen                  0-0 (0.00)                  0-1 (0.00)
 Air Force Player Split Stats (FG Pct)
               Player                  Other Ball       Nike ShotTracker Ball
             S. Tomes                27-89 (0.30)                36-88 (0.41)
           L. Scottie              105-231 (0.45)               87-190 (0.46)
             L. Brown                 5-14 (0.36)                  3-8 (0.38)
              R. Swan               76-142 (0.54)               66-134 (0.49)
             C. Joyce                37-77 (0.48)                26-74 (0.35)
        K. Van Soelen                20-47 (0.43)                11-24 (0.46)
          A.J. Walker               75-156 (0.48)               49-121 (0.40)
           A. Kinrade                16-30 (0.53)                  4-7 (0.57)
            I. Monson                  5-8 (0.62)                  0-0 (0.00)
            C. Morris                50-98 (0.51)                37-95 (0.39)
            M. Taylor                19-29 (0.66)                 5-16 (0.31)
            C. Murphy                  8-9 (0.89)                  0-9 (0.00)
      S. Pierre-Louis                  1-1 (1.00)                  0-0 (0.00)
           N. Jackson                  3-5 (0.60)                  1-4 (0.25)
      C. Vander Zwaag                  3-4 (0.75)                  1-1 (1.00)
             A. Akaya                 9-16 (0.56)                16-31 (0.52)
             C. Zwaag                  0-0 (0.00)                  0-0 (0.00)
            K. Soelen                  0-0 (0.00)                  1-1 (1.00)
 Air Force Player Split Stats (2-pt Pct)
               Player                  Other Ball       Nike ShotTracker Ball
             S. Tomes                14-29 (0.48)                15-31 (0.48)
           L. Scottie               88-181 (0.49)               72-152 (0.47)
             L. Brown                 4-11 (0.36)                  2-6 (0.33)
              R. Swan                56-90 (0.62)                49-86 (0.57)
             C. Joyce                19-32 (0.59)                12-27 (0.44)
        K. Van Soelen                16-33 (0.48)                 9-20 (0.45)
          A.J. Walker                43-88 (0.49)                33-70 (0.47)
           A. Kinrade                12-18 (0.67)                  4-5 (0.80)
            I. Monson                  4-6 (0.67)                  0-0 (0.00)
            C. Morris                11-24 (0.46)                20-41 (0.49)
            M. Taylor                11-13 (0.85)                  2-7 (0.29)
            C. Murphy                  0-0 (0.00)                  0-1 (0.00)
      S. Pierre-Louis                  1-1 (1.00)                  0-0 (0.00)
           N. Jackson                  2-4 (0.50)                  1-3 (0.33)
      C. Vander Zwaag                  3-3 (1.00)                  1-1 (1.00)
             A. Akaya                 7-14 (0.50)                15-27 (0.56)
             C. Zwaag                  0-0 (0.00)                  0-0 (0.00)
            K. Soelen                  0-0 (0.00)                  1-1 (1.00)
 Air Force Player Split Stats (3-pt Pct)
               Player                  Other Ball       Nike ShotTracker Ball
             S. Tomes                13-60 (0.22)                21-57 (0.37)
           L. Scottie                17-50 (0.34)                15-38 (0.39)
             L. Brown                  1-3 (0.33)                  1-2 (0.50)
              R. Swan                20-52 (0.38)                17-48 (0.35)
             C. Joyce                18-45 (0.40)                14-47 (0.30)
        K. Van Soelen                 4-14 (0.29)                  2-4 (0.50)
          A.J. Walker                32-68 (0.47)                16-51 (0.31)
           A. Kinrade                 4-12 (0.33)                  0-2 (0.00)
            I. Monson                  1-2 (0.50)                  0-0 (0.00)
            C. Morris                39-74 (0.53)                17-54 (0.31)
            M. Taylor                 8-16 (0.50)                  3-9 (0.33)
            C. Murphy                  8-9 (0.89)                  0-8 (0.00)
      S. Pierre-Louis                  0-0 (0.00)                  0-0 (0.00)
           N. Jackson                  1-1 (1.00)                  0-1 (0.00)
      C. Vander Zwaag                  0-1 (0.00)                  0-0 (0.00)
             A. Akaya                  2-2 (1.00)                  1-4 (0.25)
             C. Zwaag                  0-0 (0.00)                  0-0 (0.00)
            K. Soelen                  0-0 (0.00)                  0-0 (0.00)
 Boise State Player Split Stats (EFG)
               Player                  Other Ball       Nike ShotTracker Ball
             R. Jorch                        0.68                        0.52
            D. Alston                        0.50                        0.48
         M. Dickinson                        0.44                        0.51
             A. Hobbs                        0.54                        0.45
            J. Jessup                        0.50                        0.60
             B. Huang                        0.75                        0.75
              M. Rice                        0.51                        0.47
          R. Williams                        0.61                        0.65
            R. Dennis                        0.40                        0.49
             C. Berry                        0.60                        0.00
       R. Abercrombie                        0.54                        0.38
             A. Kigab                        0.47                        0.49
        M. Shaver Jr.                        0.00                        0.00
 Boise State Player Split Stats (FT Pct)
               Player                  Other Ball       Nike ShotTracker Ball
             R. Jorch                14-29 (0.48)                16-20 (0.80)
            D. Alston                79-93 (0.85)                56-74 (0.76)
         M. Dickinson                17-20 (0.85)                 8-10 (0.80)
             A. Hobbs                25-31 (0.81)                19-27 (0.70)
            J. Jessup                36-38 (0.95)                34-35 (0.97)
             B. Huang                  0-1 (0.00)                  0-0 (0.00)
              M. Rice                 6-10 (0.60)                  3-5 (0.60)
          R. Williams               73-115 (0.63)                42-62 (0.68)
            R. Dennis                14-18 (0.78)                14-17 (0.82)
             C. Berry                  0-1 (0.00)                  0-0 (0.00)
       R. Abercrombie                  0-0 (0.00)                  0-0 (0.00)
             A. Kigab                24-31 (0.77)                23-33 (0.70)
        M. Shaver Jr.                  0-0 (0.00)                  0-0 (0.00)
 Boise State Player Split Stats (FG Pct)
               Player                  Other Ball       Nike ShotTracker Ball
             R. Jorch                30-44 (0.68)                15-29 (0.52)
            D. Alston               99-235 (0.42)               78-194 (0.40)
         M. Dickinson                19-56 (0.34)                16-41 (0.39)
             A. Hobbs               62-127 (0.49)                38-95 (0.40)
            J. Jessup               80-205 (0.39)               92-199 (0.46)
             B. Huang                  1-2 (0.50)                  1-2 (0.50)
              M. Rice                20-47 (0.43)                11-31 (0.35)
          R. Williams               75-123 (0.61)                62-95 (0.65)
            R. Dennis                20-59 (0.34)                22-58 (0.38)
             C. Berry                  3-5 (0.60)                  0-0 (0.00)
       R. Abercrombie                 5-12 (0.42)                 4-13 (0.31)
             A. Kigab                37-87 (0.43)                39-94 (0.41)
        M. Shaver Jr.                  0-0 (0.00)                  0-0 (0.00)
 Boise State Player Split Stats (2-pt Pct)
               Player                  Other Ball       Nike ShotTracker Ball
             R. Jorch                30-43 (0.70)                15-25 (0.60)
            D. Alston               63-133 (0.47)               49-102 (0.48)
         M. Dickinson                 8-19 (0.42)                 6-12 (0.50)
             A. Hobbs                50-94 (0.53)                29-66 (0.44)
            J. Jessup                37-80 (0.46)                37-77 (0.48)
             B. Huang                  0-1 (0.00)                  0-1 (0.00)
              M. Rice                12-23 (0.52)                 4-14 (0.29)
          R. Williams               75-123 (0.61)                62-94 (0.66)
            R. Dennis                13-25 (0.52)                 9-15 (0.60)
             C. Berry                  3-4 (0.75)                  0-0 (0.00)
       R. Abercrombie                  2-3 (0.67)                  2-4 (0.50)
             A. Kigab                29-61 (0.48)                25-53 (0.47)
        M. Shaver Jr.                  0-0 (0.00)                  0-0 (0.00)
 Boise State Player Split Stats (3-pt Pct)
               Player                  Other Ball       Nike ShotTracker Ball
             R. Jorch                  0-1 (0.00)                  0-4 (0.00)
            D. Alston               36-102 (0.35)                29-92 (0.32)
         M. Dickinson                11-37 (0.30)                10-29 (0.34)
             A. Hobbs                12-33 (0.36)                 9-29 (0.31)
            J. Jessup               43-125 (0.34)               55-122 (0.45)
             B. Huang                  1-1 (1.00)                  1-1 (1.00)
              M. Rice                 8-24 (0.33)                 7-17 (0.41)
          R. Williams                  0-0 (0.00)                  0-1 (0.00)
            R. Dennis                 7-34 (0.21)                13-43 (0.30)
             C. Berry                  0-1 (0.00)                  0-0 (0.00)
       R. Abercrombie                  3-9 (0.33)                  2-9 (0.22)
             A. Kigab                 8-26 (0.31)                14-41 (0.34)
        M. Shaver Jr.                  0-0 (0.00)                  0-0 (0.00)
 Fresno State Player Split Stats (EFG)
               Player                  Other Ball       Nike ShotTracker Ball
          N. Williams                        0.47                        0.47
            N. Grimes                        0.60                        0.51
            C. Seeley                        0.33                        0.00
             L. Rojas                        0.67                        0.00
          M. Lawrence                        0.46                        0.42
              A. Agau                        0.60                        0.32
             A. Diouf                        0.44                        0.43
             J. Hyder                        0.52                        0.39
              N. Hart                        0.54                        0.56
          O. Robinson                        0.53                        0.50
           A. Holland                        0.47                        0.60
         N. Blackwell                        0.40                        0.70
           C.J. Hyder                        0.50                        0.00
          J. Campbell                        0.40                        0.29
 Fresno State Player Split Stats (FT Pct)
               Player                  Other Ball       Nike ShotTracker Ball
          N. Williams                23-32 (0.72)                44-51 (0.86)
            N. Grimes                17-29 (0.59)                21-36 (0.58)
            C. Seeley                  0-0 (0.00)                  0-0 (0.00)
             L. Rojas                  2-4 (0.50)                  0-1 (0.00)
          M. Lawrence                14-20 (0.70)                  2-2 (1.00)
              A. Agau                12-17 (0.71)                 8-10 (0.80)
             A. Diouf                  2-7 (0.29)                  0-2 (0.00)
             J. Hyder                23-29 (0.79)                22-25 (0.88)
              N. Hart                21-36 (0.58)                11-17 (0.65)
          O. Robinson                52-75 (0.69)                46-64 (0.72)
           A. Holland                 8-10 (0.80)                10-16 (0.62)
         N. Blackwell                10-13 (0.77)                13-16 (0.81)
           C.J. Hyder                  0-1 (0.00)                  0-0 (0.00)
          J. Campbell                  0-0 (0.00)                  4-6 (0.67)
 Fresno State Player Split Stats (FG Pct)
               Player                  Other Ball       Nike ShotTracker Ball
          N. Williams               48-134 (0.36)               52-148 (0.35)
            N. Grimes               77-148 (0.52)                42-94 (0.45)
            C. Seeley                 5-15 (0.33)                  0-0 (0.00)
             L. Rojas                  4-6 (0.67)                  0-2 (0.00)
          M. Lawrence                32-84 (0.38)                 8-25 (0.32)
              A. Agau                23-48 (0.48)                 9-28 (0.32)
             A. Diouf                 7-16 (0.44)                  3-7 (0.43)
             J. Hyder                42-98 (0.43)               39-115 (0.34)
              N. Hart               45-104 (0.43)                35-73 (0.48)
          O. Robinson               66-133 (0.50)               61-124 (0.49)
           A. Holland                17-50 (0.34)                18-45 (0.40)
         N. Blackwell                23-78 (0.29)                42-81 (0.52)
           C.J. Hyder                  1-2 (0.50)                  0-0 (0.00)
          J. Campbell                 4-10 (0.40)                10-36 (0.28)
 Fresno State Player Split Stats (2-pt Pct)
               Player                  Other Ball       Nike ShotTracker Ball
          N. Williams                18-41 (0.44)                17-45 (0.38)
            N. Grimes                54-95 (0.57)                31-59 (0.53)
            C. Seeley                 5-14 (0.36)                  0-0 (0.00)
             L. Rojas                  4-6 (0.67)                  0-0 (0.00)
          M. Lawrence                18-38 (0.47)                  3-8 (0.38)
              A. Agau                11-20 (0.55)                 9-16 (0.56)
             A. Diouf                 7-15 (0.47)                  3-7 (0.43)
             J. Hyder                24-49 (0.49)                28-68 (0.41)
              N. Hart                22-47 (0.47)                23-42 (0.55)
          O. Robinson               56-105 (0.53)               58-101 (0.57)
           A. Holland                  4-9 (0.44)                  0-6 (0.00)
         N. Blackwell                 7-20 (0.35)                13-22 (0.59)
           C.J. Hyder                  1-1 (1.00)                  0-0 (0.00)
          J. Campbell                  4-7 (0.57)                 9-28 (0.32)
 Fresno State Player Split Stats (3-pt Pct)
               Player                  Other Ball       Nike ShotTracker Ball
          N. Williams                30-93 (0.32)               35-103 (0.34)
            N. Grimes                23-53 (0.43)                11-35 (0.31)
            C. Seeley                  0-1 (0.00)                  0-0 (0.00)
             L. Rojas                  0-0 (0.00)                  0-2 (0.00)
          M. Lawrence                14-46 (0.30)                 5-17 (0.29)
              A. Agau                12-28 (0.43)                 0-12 (0.00)
             A. Diouf                  0-1 (0.00)                  0-0 (0.00)
             J. Hyder                18-49 (0.37)                11-47 (0.23)
              N. Hart                23-57 (0.40)                12-31 (0.39)
          O. Robinson                10-28 (0.36)                 3-23 (0.13)
           A. Holland                13-41 (0.32)                18-39 (0.46)
         N. Blackwell                16-58 (0.28)                29-59 (0.49)
           C.J. Hyder                  0-1 (0.00)                  0-0 (0.00)
          J. Campbell                  0-3 (0.00)                  1-8 (0.12)
 New Mexico Player Split Stats (EFG)
               Player                  Other Ball       Nike ShotTracker Ball
              J. Lyle                        0.53                        0.49
         C. Bragg Jr.                        0.57                        0.48
         C. Manigault                        0.58                        0.54
          J. Caldwell                        0.51                        0.40
           V. Jackson                        0.46                        0.62
            Z. Martin                        0.47                        0.43
           M. Maluach                        0.57                        0.50
             K. McGee                        0.55                        0.61
             T. Percy                        0.70                        0.36
            J. Arroyo                        0.50                        0.40
         C. Patterson                        0.00                        0.00
              E. Kuac                        0.50                        0.63
       K. Wegscheider                        0.59                        0.56
           V. Hendrix                        0.54                        0.58
 New Mexico Player Split Stats (FT Pct)
               Player                  Other Ball       Nike ShotTracker Ball
              J. Lyle                66-85 (0.78)                28-41 (0.68)
         C. Bragg Jr.                48-58 (0.83)                  6-8 (0.75)
         C. Manigault                61-95 (0.64)                43-54 (0.80)
          J. Caldwell                22-29 (0.76)                  0-0 (0.00)
           V. Jackson                35-50 (0.70)                25-34 (0.74)
            Z. Martin                46-60 (0.77)                28-45 (0.62)
           M. Maluach                32-45 (0.71)                21-28 (0.75)
             K. McGee                  3-9 (0.33)                  6-6 (1.00)
             T. Percy                  2-3 (0.67)                  1-2 (0.50)
            J. Arroyo                  0-2 (0.00)                  4-4 (1.00)
         C. Patterson                  2-2 (1.00)                  4-4 (1.00)
              E. Kuac                  0-2 (0.00)                  1-4 (0.25)
       K. Wegscheider                  2-5 (0.40)                  2-2 (1.00)
           V. Hendrix                16-20 (0.80)                13-21 (0.62)
 New Mexico Player Split Stats (FG Pct)
               Player                  Other Ball       Nike ShotTracker Ball
              J. Lyle               95-213 (0.45)               46-115 (0.40)
         C. Bragg Jr.                54-98 (0.55)                12-25 (0.48)
         C. Manigault               86-151 (0.57)               64-124 (0.52)
          J. Caldwell                22-45 (0.49)                 4-10 (0.40)
           V. Jackson               60-156 (0.38)                41-88 (0.47)
            Z. Martin               66-155 (0.43)               53-132 (0.40)
           M. Maluach               73-142 (0.51)               44-102 (0.43)
             K. McGee                38-81 (0.47)                33-69 (0.48)
             T. Percy                13-22 (0.59)                  2-7 (0.29)
            J. Arroyo                  1-2 (0.50)                 4-10 (0.40)
         C. Patterson                  0-1 (0.00)                  0-1 (0.00)
              E. Kuac                  3-8 (0.38)                 9-15 (0.60)
       K. Wegscheider                 9-16 (0.56)                  5-9 (0.56)
           V. Hendrix                30-67 (0.45)                25-49 (0.51)
 New Mexico Player Split Stats (2-pt Pct)
               Player                  Other Ball       Nike ShotTracker Ball
              J. Lyle               59-118 (0.50)                25-50 (0.50)
         C. Bragg Jr.                51-93 (0.55)                12-23 (0.52)
         C. Manigault               84-142 (0.59)               58-108 (0.54)
          J. Caldwell                20-39 (0.51)                  4-7 (0.57)
           V. Jackson                37-66 (0.56)                14-32 (0.44)
            Z. Martin               53-107 (0.50)                45-96 (0.47)
           M. Maluach                58-91 (0.64)                30-60 (0.50)
             K. McGee                25-40 (0.62)                15-25 (0.60)
             T. Percy                 8-11 (0.73)                  1-4 (0.25)
            J. Arroyo                  1-2 (0.50)                  4-9 (0.44)
         C. Patterson                  0-0 (0.00)                  0-0 (0.00)
              E. Kuac                  1-4 (0.25)                 8-10 (0.80)
       K. Wegscheider                 8-11 (0.73)                  5-7 (0.71)
           V. Hendrix                18-33 (0.55)                18-21 (0.86)
 New Mexico Player Split Stats (3-pt Pct)
               Player                  Other Ball       Nike ShotTracker Ball
              J. Lyle                36-95 (0.38)                21-65 (0.32)
         C. Bragg Jr.                  3-5 (0.60)                  0-2 (0.00)
         C. Manigault                  2-9 (0.22)                 6-16 (0.38)
          J. Caldwell                  2-6 (0.33)                  0-3 (0.00)
           V. Jackson                23-90 (0.26)                27-56 (0.48)
            Z. Martin                13-48 (0.27)                 8-36 (0.22)
           M. Maluach                15-51 (0.29)                14-42 (0.33)
             K. McGee                13-41 (0.32)                18-44 (0.41)
             T. Percy                 5-11 (0.45)                  1-3 (0.33)
            J. Arroyo                  0-0 (0.00)                  0-1 (0.00)
         C. Patterson                  0-1 (0.00)                  0-1 (0.00)
              E. Kuac                  2-4 (0.50)                  1-5 (0.20)
       K. Wegscheider                  1-5 (0.20)                  0-2 (0.00)
           V. Hendrix                12-34 (0.35)                 7-28 (0.25)
 San Diego State Player Split Stats (EFG)
               Player                  Other Ball       Nike ShotTracker Ball
            K. Feagin                        0.48                        0.52
             M. Flynn                        0.53                        0.54
           Y. Wetzell                        0.62                        0.58
             A. Seiko                        0.67                        0.43
          M. Mitchell                        0.53                        0.60
           J. Schakel                        0.64                        0.56
              A. Arop                        0.52                        0.38
          C. Giordano                        0.56                        0.00
            N. Mensah                        0.62                        0.60
            J. Mensah                        0.60                        0.64
           K. Johnson                        0.44                        0.33
           T. Pulliam                        0.40                        0.57
           J. Barnett                        0.17                        0.00
            N. Narain                        0.90                        0.54
 San Diego State Player Split Stats (FT Pct)
               Player                  Other Ball       Nike ShotTracker Ball
            K. Feagin                21-25 (0.84)                 9-11 (0.82)
             M. Flynn                71-86 (0.83)                49-54 (0.91)
           Y. Wetzell                45-63 (0.71)                16-32 (0.50)
             A. Seiko                  6-6 (1.00)                  1-3 (0.33)
          M. Mitchell                60-68 (0.88)                36-42 (0.86)
           J. Schakel                17-19 (0.89)                21-22 (0.95)
              A. Arop                  3-6 (0.50)                  2-2 (1.00)
          C. Giordano                  0-2 (0.00)                  0-0 (0.00)
            N. Mensah                12-20 (0.60)                  4-5 (0.80)
            J. Mensah                  0-1 (0.00)                  1-2 (0.50)
           K. Johnson                 6-10 (0.60)                  0-6 (0.00)
           T. Pulliam                 5-11 (0.45)                 9-11 (0.82)
           J. Barnett                  0-0 (0.00)                  1-2 (0.50)
            N. Narain                  1-1 (1.00)                  4-9 (0.44)
 San Diego State Player Split Stats (FG Pct)
               Player                  Other Ball       Nike ShotTracker Ball
            K. Feagin               60-162 (0.37)               41-101 (0.41)
             M. Flynn              118-271 (0.44)               66-146 (0.45)
           Y. Wetzell               89-147 (0.61)               62-108 (0.57)
             A. Seiko                20-42 (0.48)                 8-23 (0.35)
          M. Mitchell               78-173 (0.45)                47-94 (0.50)
           J. Schakel               66-143 (0.46)                39-89 (0.44)
              A. Arop                29-56 (0.52)                  3-8 (0.38)
          C. Giordano                  3-8 (0.38)                  0-2 (0.00)
            N. Mensah                31-50 (0.62)                 6-10 (0.60)
            J. Mensah                12-20 (0.60)                 7-11 (0.64)
           K. Johnson                 9-25 (0.36)                  3-9 (0.33)
           T. Pulliam                21-55 (0.38)                22-43 (0.51)
           J. Barnett                  1-6 (0.17)                  0-0 (0.00)
            N. Narain                  4-5 (0.80)                 7-13 (0.54)
 San Diego State Player Split Stats (2-pt Pct)
               Player                  Other Ball       Nike ShotTracker Ball
            K. Feagin                26-65 (0.40)                17-47 (0.36)
             M. Flynn               67-135 (0.50)                41-78 (0.53)
           Y. Wetzell               84-131 (0.64)               60-102 (0.59)
             A. Seiko                  4-6 (0.67)                  4-5 (0.80)
          M. Mitchell               52-102 (0.51)                29-53 (0.55)
           J. Schakel                16-39 (0.41)                18-30 (0.60)
              A. Arop                29-50 (0.58)                  3-8 (0.38)
          C. Giordano                  0-0 (0.00)                  0-0 (0.00)
            N. Mensah                31-50 (0.62)                 6-10 (0.60)
            J. Mensah                12-20 (0.60)                 7-11 (0.64)
           K. Johnson                 5-12 (0.42)                  3-4 (0.75)
           T. Pulliam                19-47 (0.40)                17-30 (0.57)
           J. Barnett                  1-5 (0.20)                  0-0 (0.00)
            N. Narain                  3-4 (0.75)                 7-11 (0.64)
 San Diego State Player Split Stats (3-pt Pct)
               Player                  Other Ball       Nike ShotTracker Ball
            K. Feagin                34-97 (0.35)                24-54 (0.44)
             M. Flynn               51-136 (0.38)                25-68 (0.37)
           Y. Wetzell                 5-16 (0.31)                  2-6 (0.33)
             A. Seiko                16-36 (0.44)                 4-18 (0.22)
          M. Mitchell                26-71 (0.37)                18-41 (0.44)
           J. Schakel               50-104 (0.48)                21-59 (0.36)
              A. Arop                  0-6 (0.00)                  0-0 (0.00)
          C. Giordano                  3-8 (0.38)                  0-2 (0.00)
            N. Mensah                  0-0 (0.00)                  0-0 (0.00)
            J. Mensah                  0-0 (0.00)                  0-0 (0.00)
           K. Johnson                 4-13 (0.31)                  0-5 (0.00)
           T. Pulliam                  2-8 (0.25)                 5-13 (0.38)
           J. Barnett                  0-1 (0.00)                  0-0 (0.00)
            N. Narain                  1-1 (1.00)                  0-2 (0.00)
 UNLV Player Split Stats (EFG)
               Player                  Other Ball       Nike ShotTracker Ball
             N. Blair                        0.60                        0.65
       E. Mitrou-Long                        0.53                        0.55
           C. Dembele                        0.00                        0.00
           J. Antonio                        0.49                        0.42
           D. Tillman                        0.45                        0.38
             C. Diong                        0.59                        0.49
             A. Hardy                        0.48                        0.50
          B. Hamilton                        0.44                        0.56
            V. Shibel                        0.57                        0.41
             J. Green                        0.57                        0.75
           M. Coleman                        0.46                        0.52
          T. Hurlburt                        0.00                        0.00
 UNLV Player Split Stats (FT Pct)
               Player                  Other Ball       Nike ShotTracker Ball
             N. Blair                12-20 (0.60)                14-22 (0.64)
       E. Mitrou-Long                31-38 (0.82)                  4-9 (0.44)
           C. Dembele                  1-2 (0.50)                  0-0 (0.00)
           J. Antonio                  1-3 (0.33)                  2-4 (0.50)
           D. Tillman                55-73 (0.75)                33-44 (0.75)
             C. Diong                41-66 (0.62)                19-27 (0.70)
             A. Hardy                42-56 (0.75)                34-53 (0.64)
          B. Hamilton                45-65 (0.69)                46-69 (0.67)
            V. Shibel                 6-11 (0.55)                  8-9 (0.89)
             J. Green                  0-2 (0.00)                  2-9 (0.22)
           M. Coleman                23-32 (0.72)                23-25 (0.92)
          T. Hurlburt                  0-0 (0.00)                  0-0 (0.00)
 UNLV Player Split Stats (FG Pct)
               Player                  Other Ball       Nike ShotTracker Ball
             N. Blair                31-55 (0.56)                22-34 (0.65)
       E. Mitrou-Long               55-123 (0.45)                33-68 (0.49)
           C. Dembele                  0-3 (0.00)                  0-0 (0.00)
           J. Antonio               34-102 (0.33)                24-84 (0.29)
           D. Tillman               51-132 (0.39)                21-60 (0.35)
             C. Diong               59-101 (0.58)                34-70 (0.49)
             A. Hardy               99-248 (0.40)               64-151 (0.42)
          B. Hamilton               86-220 (0.39)              106-204 (0.52)
            V. Shibel                15-30 (0.50)                10-29 (0.34)
             J. Green                  4-7 (0.57)                  3-4 (0.75)
           M. Coleman                24-62 (0.39)                37-86 (0.43)
          T. Hurlburt                  0-1 (0.00)                  0-2 (0.00)
 UNLV Player Split Stats (2-pt Pct)
               Player                  Other Ball       Nike ShotTracker Ball
             N. Blair                27-42 (0.64)                22-29 (0.76)
       E. Mitrou-Long                35-66 (0.53)                24-41 (0.59)
           C. Dembele                  0-3 (0.00)                  0-0 (0.00)
           J. Antonio                 3-10 (0.30)                  2-8 (0.25)
           D. Tillman                34-78 (0.44)                17-42 (0.40)
             C. Diong                58-98 (0.59)                34-63 (0.54)
             A. Hardy               60-126 (0.48)                40-84 (0.48)
          B. Hamilton               64-158 (0.41)               90-154 (0.58)
            V. Shibel                11-16 (0.69)                 6-16 (0.38)
             J. Green                  4-7 (0.57)                  3-4 (0.75)
           M. Coleman                15-35 (0.43)                22-39 (0.56)
          T. Hurlburt                  0-1 (0.00)                  0-1 (0.00)
 UNLV Player Split Stats (3-pt Pct)
               Player                  Other Ball       Nike ShotTracker Ball
             N. Blair                 4-13 (0.31)                  0-5 (0.00)
       E. Mitrou-Long                20-57 (0.35)                 9-27 (0.33)
           C. Dembele                  0-0 (0.00)                  0-0 (0.00)
           J. Antonio                31-92 (0.34)                22-76 (0.29)
           D. Tillman                17-54 (0.31)                 4-18 (0.22)
             C. Diong                  1-3 (0.33)                  0-7 (0.00)
             A. Hardy               39-122 (0.32)                24-67 (0.36)
          B. Hamilton                22-62 (0.35)                16-50 (0.32)
            V. Shibel                 4-14 (0.29)                 4-13 (0.31)
             J. Green                  0-0 (0.00)                  0-0 (0.00)
           M. Coleman                 9-27 (0.33)                15-47 (0.32)
          T. Hurlburt                  0-0 (0.00)                  0-1 (0.00)
 Utah State Player Split Stats (EFG)
               Player                  Other Ball       Nike ShotTracker Ball
          A. Anderson                        0.58                        0.46
           S. Merrill                        0.57                        0.56
             D. Brito                        0.50                        0.41
            A. Porter                        0.50                        0.39
            T. Dorius                        0.54                        0.47
              J. Bean                        0.52                        0.56
            B. Miller                        0.51                        0.37
          S. Bairstow                        0.55                        0.44
         K. Karwowski                        0.64                        0.33
             K. Stall                        0.20                        0.00
         R. Grootfaam                        0.73                        0.42
             N. Queta                        0.64                        0.62
 Utah State Player Split Stats (FT Pct)
               Player                  Other Ball       Nike ShotTracker Ball
          A. Anderson                50-63 (0.79)                 7-13 (0.54)
           S. Merrill                79-92 (0.86)                71-76 (0.93)
             D. Brito                34-40 (0.85)                21-29 (0.72)
            A. Porter                27-35 (0.77)                27-36 (0.75)
            T. Dorius                10-26 (0.38)                  2-5 (0.40)
              J. Bean                48-61 (0.79)                39-47 (0.83)
            B. Miller                15-18 (0.83)                 9-11 (0.82)
          S. Bairstow                11-15 (0.73)                  4-6 (0.67)
         K. Karwowski                 6-16 (0.38)                  0-1 (0.00)
             K. Stall                  3-4 (0.75)                  0-0 (0.00)
         R. Grootfaam                  6-8 (0.75)                  4-5 (0.80)
             N. Queta                21-34 (0.62)                48-69 (0.70)
 Utah State Player Split Stats (FG Pct)
               Player                  Other Ball       Nike ShotTracker Ball
          A. Anderson               72-138 (0.52)                27-64 (0.42)
           S. Merrill              110-237 (0.46)               85-186 (0.46)
             D. Brito               64-149 (0.43)               34-102 (0.33)
            A. Porter                38-91 (0.42)                20-61 (0.33)
            T. Dorius                21-39 (0.54)                 7-15 (0.47)
              J. Bean               97-190 (0.51)               58-108 (0.54)
            B. Miller               71-183 (0.39)               29-101 (0.29)
          S. Bairstow                20-41 (0.49)                13-33 (0.39)
         K. Karwowski                16-25 (0.64)                  1-3 (0.33)
             K. Stall                  1-5 (0.20)                  0-0 (0.00)
         R. Grootfaam                 8-11 (0.73)                 5-12 (0.42)
             N. Queta                41-64 (0.64)               67-109 (0.61)
 Utah State Player Split Stats (2-pt Pct)
               Player                  Other Ball       Nike ShotTracker Ball
          A. Anderson                56-90 (0.62)                22-48 (0.46)
           S. Merrill               58-123 (0.47)                48-83 (0.58)
             D. Brito                42-75 (0.56)                18-42 (0.43)
            A. Porter                23-46 (0.50)                13-32 (0.41)
            T. Dorius                21-39 (0.54)                 7-15 (0.47)
              J. Bean               95-175 (0.54)                52-94 (0.55)
            B. Miller                27-55 (0.49)                12-29 (0.41)
          S. Bairstow                15-24 (0.62)                10-26 (0.38)
         K. Karwowski                16-23 (0.70)                  1-3 (0.33)
             K. Stall                  1-5 (0.20)                  0-0 (0.00)
         R. Grootfaam                 8-11 (0.73)                 5-12 (0.42)
             N. Queta                41-64 (0.64)               66-108 (0.61)
 Utah State Player Split Stats (3-pt Pct)
               Player                  Other Ball       Nike ShotTracker Ball
          A. Anderson                16-48 (0.33)                 5-16 (0.31)
           S. Merrill               52-114 (0.46)               37-103 (0.36)
             D. Brito                22-74 (0.30)                16-60 (0.27)
            A. Porter                15-45 (0.33)                 7-29 (0.24)
            T. Dorius                  0-0 (0.00)                  0-0 (0.00)
              J. Bean                 2-15 (0.13)                 6-14 (0.43)
            B. Miller               44-128 (0.34)                17-72 (0.24)
          S. Bairstow                 5-17 (0.29)                  3-7 (0.43)
         K. Karwowski                  0-2 (0.00)                  0-0 (0.00)
             K. Stall                  0-0 (0.00)                  0-0 (0.00)
         R. Grootfaam                  0-0 (0.00)                  0-0 (0.00)
             N. Queta                  0-0 (0.00)                  1-1 (1.00)
 Colorado State Player Split Stats (EFG)
               Player                  Other Ball       Nike ShotTracker Ball
            K. Martin                        0.46                        0.45
          N. Carvacho                        0.56                        0.59
           H. Edwards                        0.51                        0.37
             K. Moore                        0.61                        0.57
       A. Thistlewood                        0.62                        0.38
           I. Stevens                        0.56                        0.40
            D. Thomas                        0.69                        0.50
             D. Roddy                        0.50                        0.47
             J. Tonje                        0.55                        0.79
       K. Lukasiewicz                        0.83                        1.00
            P.J. Byrd                        0.57                        0.50
 Colorado State Player Split Stats (FT Pct)
               Player                  Other Ball       Nike ShotTracker Ball
            K. Martin                21-30 (0.70)                12-18 (0.67)
          N. Carvacho               86-174 (0.49)                10-22 (0.45)
           H. Edwards                17-20 (0.85)                  1-3 (0.33)
             K. Moore                37-52 (0.71)                  5-6 (0.83)
       A. Thistlewood                55-69 (0.80)                  5-6 (0.83)
           I. Stevens                72-87 (0.83)                12-16 (0.75)
            D. Thomas                27-38 (0.71)                  0-1 (0.00)
             D. Roddy               79-103 (0.77)                 9-16 (0.56)
             J. Tonje                18-27 (0.67)                  3-4 (0.75)
       K. Lukasiewicz                  0-0 (0.00)                  0-1 (0.00)
            P.J. Byrd                  5-5 (1.00)                  1-2 (0.50)
 Colorado State Player Split Stats (FG Pct)
               Player                  Other Ball       Nike ShotTracker Ball
            K. Martin               69-190 (0.36)                11-33 (0.33)
          N. Carvacho              129-231 (0.56)                29-49 (0.59)
           H. Edwards                42-92 (0.46)                 8-23 (0.35)
             K. Moore               78-169 (0.46)                15-34 (0.44)
       A. Thistlewood               80-167 (0.48)                10-39 (0.26)
           I. Stevens              132-273 (0.48)                15-42 (0.36)
            D. Thomas                43-64 (0.67)                  4-8 (0.50)
             D. Roddy              112-237 (0.47)                19-45 (0.42)
             J. Tonje                28-64 (0.44)                 7-12 (0.58)
       K. Lukasiewicz                  2-3 (0.67)                  1-1 (1.00)
            P.J. Byrd                 6-14 (0.43)                  1-2 (0.50)
 Colorado State Player Split Stats (2-pt Pct)
               Player                  Other Ball       Nike ShotTracker Ball
            K. Martin                34-79 (0.43)                 3-11 (0.27)
          N. Carvacho              129-231 (0.56)                29-49 (0.59)
           H. Edwards                33-64 (0.52)                 7-20 (0.35)
             K. Moore                27-58 (0.47)                  6-7 (0.86)
       A. Thistlewood                33-51 (0.65)                 0-10 (0.00)
           I. Stevens               90-170 (0.53)                11-24 (0.46)
            D. Thomas                41-59 (0.69)                  4-8 (0.50)
             D. Roddy              101-176 (0.57)                15-29 (0.52)
             J. Tonje                13-24 (0.54)                  2-6 (0.33)
       K. Lukasiewicz                  1-1 (1.00)                  1-1 (1.00)
            P.J. Byrd                  2-7 (0.29)                  1-2 (0.50)
 Colorado State Player Split Stats (3-pt Pct)
               Player                  Other Ball       Nike ShotTracker Ball
            K. Martin               35-111 (0.32)                 8-22 (0.36)
          N. Carvacho                  0-0 (0.00)                  0-0 (0.00)
           H. Edwards                 9-28 (0.32)                  1-3 (0.33)
             K. Moore               51-111 (0.46)                 9-27 (0.33)
       A. Thistlewood               47-116 (0.41)                10-29 (0.34)
           I. Stevens               42-103 (0.41)                 4-18 (0.22)
            D. Thomas                  2-5 (0.40)                  0-0 (0.00)
             D. Roddy                11-61 (0.18)                 4-16 (0.25)
             J. Tonje                15-40 (0.38)                  5-6 (0.83)
       K. Lukasiewicz                  1-2 (0.50)                  0-0 (0.00)
            P.J. Byrd                  4-7 (0.57)                  0-0 (0.00)
 Nevada Player Split Stats (EFG)
               Player                  Other Ball       Nike ShotTracker Ball
              L. Drew                        0.60                        0.43
           J. Johnson                        0.53                        0.54
             J. Reyes                        0.56                        0.50
           N. Zouzoua                        0.57                        0.34
            J. Harris                        0.49                        0.59
           K.J. Hymes                        0.57                        0.42
          R. Robinson                        0.52                        0.50
           K. Milling                        0.33                        0.71
             Z. Meeks                        0.52                        0.63
          G. Bansuelo                        0.00                        0.00
          Z. Williams                        0.00                        0.00
 Nevada Player Split Stats (FT Pct)
               Player                  Other Ball       Nike ShotTracker Ball
              L. Drew                36-49 (0.73)                10-13 (0.77)
           J. Johnson                55-62 (0.89)                15-22 (0.68)
             J. Reyes                19-31 (0.61)                  3-6 (0.50)
           N. Zouzoua                42-49 (0.86)                 9-12 (0.75)
            J. Harris              101-122 (0.83)                34-42 (0.81)
           K.J. Hymes                36-52 (0.69)                 7-15 (0.47)
          R. Robinson                 9-19 (0.47)                  4-5 (0.80)
           K. Milling                 9-17 (0.53)                  2-3 (0.67)
             Z. Meeks                  5-8 (0.62)                  4-4 (1.00)
          G. Bansuelo                  0-0 (0.00)                  0-0 (0.00)
          Z. Williams                  0-0 (0.00)                  0-0 (0.00)
 Nevada Player Split Stats (FG Pct)
               Player                  Other Ball       Nike ShotTracker Ball
              L. Drew              115-222 (0.52)                16-45 (0.36)
           J. Johnson              125-308 (0.41)                25-59 (0.42)
             J. Reyes                54-96 (0.56)                 7-14 (0.50)
           N. Zouzoua               86-192 (0.45)                14-47 (0.30)
            J. Harris              166-388 (0.43)               58-114 (0.51)
           K.J. Hymes                36-65 (0.55)                 5-12 (0.42)
          R. Robinson                30-58 (0.52)                 5-10 (0.50)
           K. Milling                17-60 (0.28)                 7-14 (0.50)
             Z. Meeks               56-136 (0.41)                19-38 (0.50)
          G. Bansuelo                  0-2 (0.00)                  0-0 (0.00)
          Z. Williams                  0-1 (0.00)                  0-0 (0.00)
 Nevada Player Split Stats (2-pt Pct)
               Player                  Other Ball       Nike ShotTracker Ball
              L. Drew               77-129 (0.60)                 9-25 (0.36)
           J. Johnson               48-125 (0.38)                11-24 (0.46)
             J. Reyes                54-96 (0.56)                 7-14 (0.50)
           N. Zouzoua                38-91 (0.42)                10-23 (0.43)
            J. Harris              117-251 (0.47)                40-66 (0.61)
           K.J. Hymes                34-60 (0.57)                 5-11 (0.45)
          R. Robinson                30-56 (0.54)                 5-10 (0.50)
           K. Milling                11-24 (0.46)                  1-5 (0.20)
             Z. Meeks                26-49 (0.53)                 9-15 (0.60)
          G. Bansuelo                  0-0 (0.00)                  0-0 (0.00)
          Z. Williams                  0-1 (0.00)                  0-0 (0.00)
 Nevada Player Split Stats (3-pt Pct)
               Player                  Other Ball       Nike ShotTracker Ball
              L. Drew                38-93 (0.41)                 7-20 (0.35)
           J. Johnson               77-183 (0.42)                14-35 (0.40)
             J. Reyes                  0-0 (0.00)                  0-0 (0.00)
           N. Zouzoua               48-101 (0.48)                 4-24 (0.17)
            J. Harris               49-137 (0.36)                18-48 (0.38)
           K.J. Hymes                  2-5 (0.40)                  0-1 (0.00)
          R. Robinson                  0-2 (0.00)                  0-0 (0.00)
           K. Milling                 6-36 (0.17)                  6-9 (0.67)
             Z. Meeks                30-87 (0.34)                10-23 (0.43)
          G. Bansuelo                  0-2 (0.00)                  0-0 (0.00)
          Z. Williams                  0-0 (0.00)                  0-0 (0.00)
 San Jose State Player Split Stats (EFG)
               Player                  Other Ball       Nike ShotTracker Ball
    S. Japhet-Mathias                        0.33                        0.38
           C. LeCesne                        0.37                        0.00
           I. Nichols                        0.40                        0.14
              B. Ivey                        0.46                        0.47
          Z. Chappell                        0.42                        0.39
            C. Anigwe                        0.50                        0.43
            S. Knight                        0.47                        0.47
             O. Moore                        0.53                        0.55
              E. Lane                        0.58                        0.47
        R. Washington                        0.44                        0.57
              R. Agee                        0.48                        0.43
             T. Smith                        0.50                        0.25
          K. Hammonds                        0.51                        0.50
          H. Dhaliwal                        0.50                        0.00
           C. Simmons                        0.44                        0.00
 San Jose State Player Split Stats (FT Pct)
               Player                  Other Ball       Nike ShotTracker Ball
    S. Japhet-Mathias                11-17 (0.65)                  0-0 (0.00)
           C. LeCesne                15-16 (0.94)                  0-0 (0.00)
           I. Nichols                  3-5 (0.60)                  3-3 (1.00)
              B. Ivey                48-56 (0.86)                14-18 (0.78)
          Z. Chappell                41-55 (0.75)                 9-14 (0.64)
            C. Anigwe                28-53 (0.53)                  3-7 (0.43)
            S. Knight              129-167 (0.77)                27-35 (0.77)
             O. Moore                17-24 (0.71)                 8-10 (0.80)
              E. Lane                10-21 (0.48)                  2-9 (0.22)
        R. Washington                32-44 (0.73)                  8-8 (1.00)
              R. Agee                21-33 (0.64)                 7-11 (0.64)
             T. Smith                  3-9 (0.33)                  2-2 (1.00)
          K. Hammonds                  4-4 (1.00)                  5-7 (0.71)
          H. Dhaliwal                  0-0 (0.00)                  3-4 (0.75)
           C. Simmons                  1-2 (0.50)                  0-0 (0.00)
 San Jose State Player Split Stats (FG Pct)
               Player                  Other Ball       Nike ShotTracker Ball
    S. Japhet-Mathias                21-66 (0.32)                  3-8 (0.38)
           C. LeCesne                28-78 (0.36)                  0-3 (0.00)
           I. Nichols                 3-10 (0.30)                  1-7 (0.14)
              B. Ivey               58-171 (0.34)                21-58 (0.36)
          Z. Chappell               47-134 (0.35)                12-35 (0.34)
            C. Anigwe               47-105 (0.45)                10-28 (0.36)
            S. Knight              129-316 (0.41)                33-86 (0.38)
             O. Moore                44-88 (0.50)                15-29 (0.52)
              E. Lane                26-46 (0.57)                 9-19 (0.47)
        R. Washington               80-231 (0.35)                29-67 (0.43)
              R. Agee               47-104 (0.45)                15-38 (0.39)
             T. Smith                17-48 (0.35)                 2-10 (0.20)
          K. Hammonds                14-38 (0.37)                13-32 (0.41)
          H. Dhaliwal                  1-2 (0.50)                  0-2 (0.00)
           C. Simmons                  3-8 (0.38)                  0-4 (0.00)
 San Jose State Player Split Stats (2-pt Pct)
               Player                  Other Ball       Nike ShotTracker Ball
    S. Japhet-Mathias                20-54 (0.37)                  3-5 (0.60)
           C. LeCesne                26-58 (0.45)                  0-2 (0.00)
           I. Nichols                  1-2 (0.50)                  1-6 (0.17)
              B. Ivey                17-44 (0.39)                 9-21 (0.43)
          Z. Chappell                28-82 (0.34)                 9-20 (0.45)
            C. Anigwe                35-59 (0.59)                 6-12 (0.50)
            S. Knight               93-185 (0.50)                19-47 (0.40)
             O. Moore                38-62 (0.61)                13-21 (0.62)
              E. Lane                25-43 (0.58)                 9-18 (0.50)
        R. Washington                37-92 (0.40)                11-24 (0.46)
              R. Agee                42-84 (0.50)                12-27 (0.44)
             T. Smith                 3-14 (0.21)                  1-2 (0.50)
          K. Hammonds                  3-8 (0.38)                 7-11 (0.64)
          H. Dhaliwal                  1-2 (0.50)                  0-2 (0.00)
           C. Simmons                  2-3 (0.67)                  0-0 (0.00)
 San Jose State Player Split Stats (3-pt Pct)
               Player                  Other Ball       Nike ShotTracker Ball
    S. Japhet-Mathias                 1-12 (0.08)                  0-3 (0.00)
           C. LeCesne                 2-20 (0.10)                  0-1 (0.00)
           I. Nichols                  2-8 (0.25)                  0-1 (0.00)
              B. Ivey               41-127 (0.32)                12-37 (0.32)
          Z. Chappell                19-52 (0.37)                 3-15 (0.20)
            C. Anigwe                12-46 (0.26)                 4-16 (0.25)
            S. Knight               36-131 (0.27)                14-39 (0.36)
             O. Moore                 6-26 (0.23)                  2-8 (0.25)
              E. Lane                  1-3 (0.33)                  0-1 (0.00)
        R. Washington               43-139 (0.31)                18-43 (0.42)
              R. Agee                 5-20 (0.25)                 3-11 (0.27)
             T. Smith                14-34 (0.41)                  1-8 (0.12)
          K. Hammonds                11-30 (0.37)                 6-21 (0.29)
          H. Dhaliwal                  0-0 (0.00)                  0-0 (0.00)
           C. Simmons                  1-5 (0.20)                  0-4 (0.00)
 Wyoming Player Split Stats (EFG)
               Player                  Other Ball       Nike ShotTracker Ball
           A. Mueller                        0.33                        0.00
         H. Maldonado                        0.46                        0.46
          H. Thompson                        0.50                        0.40
           A.J. Banks                        0.56                        0.50
         J. Hendricks                        0.48                        0.45
            B. Porter                        0.59                        0.38
            T. Taylor                        0.48                        0.65
         K. Marble II                        0.55                        0.53
        G. Milton III                        0.43                        0.53
            K. Foster                        0.41                        0.40
            J. Turner                        0.00                        0.00
         H. Fornstrom                        1.00                        1.00
            T. Morman                        1.00                        0.00
 Wyoming Player Split Stats (FT Pct)
               Player                  Other Ball       Nike ShotTracker Ball
           A. Mueller                  1-3 (0.33)                  0-0 (0.00)
         H. Maldonado              105-148 (0.71)                16-23 (0.70)
          H. Thompson                33-46 (0.72)                  0-0 (0.00)
           A.J. Banks                33-46 (0.72)                  3-5 (0.60)
         J. Hendricks                26-34 (0.76)                10-10 (1.00)
            B. Porter                  4-8 (0.50)                  6-6 (1.00)
            T. Taylor                43-59 (0.73)                13-14 (0.93)
         K. Marble II                41-50 (0.82)                10-17 (0.59)
        G. Milton III                13-20 (0.65)                  6-8 (0.75)
            K. Foster                19-27 (0.70)                  3-5 (0.60)
            J. Turner                  0-0 (0.00)                  0-0 (0.00)
         H. Fornstrom                  1-2 (0.50)                  0-0 (0.00)
            T. Morman                  0-0 (0.00)                  0-0 (0.00)
 Wyoming Player Split Stats (FG Pct)
               Player                  Other Ball       Nike ShotTracker Ball
           A. Mueller                 7-21 (0.33)                  0-0 (0.00)
         H. Maldonado              155-367 (0.42)                28-67 (0.42)
          H. Thompson               70-175 (0.40)                  2-5 (0.40)
           A.J. Banks                47-93 (0.51)                 9-20 (0.45)
         J. Hendricks               89-261 (0.34)                19-62 (0.31)
            B. Porter                21-43 (0.49)                 5-17 (0.29)
            T. Taylor               59-129 (0.46)                23-40 (0.57)
         K. Marble II               58-120 (0.48)                18-37 (0.49)
        G. Milton III                29-82 (0.35)                14-32 (0.44)
            K. Foster               46-136 (0.34)                 9-25 (0.36)
            J. Turner                  0-2 (0.00)                  0-0 (0.00)
         H. Fornstrom                  2-3 (0.67)                  1-1 (1.00)
            T. Morman                  1-1 (1.00)                  0-0 (0.00)
 Wyoming Player Split Stats (2-pt Pct)
               Player                  Other Ball       Nike ShotTracker Ball
           A. Mueller                 7-19 (0.37)                  0-0 (0.00)
         H. Maldonado              124-262 (0.47)                23-50 (0.46)
          H. Thompson                35-71 (0.49)                  2-3 (0.67)
           A.J. Banks                36-65 (0.55)                 7-15 (0.47)
         J. Hendricks                16-40 (0.40)                  1-5 (0.20)
            B. Porter                12-20 (0.60)                  2-4 (0.50)
            T. Taylor               53-106 (0.50)                17-31 (0.55)
         K. Marble II                42-79 (0.53)                15-25 (0.60)
        G. Milton III                16-39 (0.41)                 8-16 (0.50)
            K. Foster                27-60 (0.45)                 7-15 (0.47)
            J. Turner                  0-2 (0.00)                  0-0 (0.00)
         H. Fornstrom                  0-1 (0.00)                  1-1 (1.00)
            T. Morman                  1-1 (1.00)                  0-0 (0.00)
 Wyoming Player Split Stats (3-pt Pct)
               Player                  Other Ball       Nike ShotTracker Ball
           A. Mueller                  0-2 (0.00)                  0-0 (0.00)
         H. Maldonado               31-105 (0.30)                 5-17 (0.29)
          H. Thompson               35-104 (0.34)                  0-2 (0.00)
           A.J. Banks                11-28 (0.39)                  2-5 (0.40)
         J. Hendricks               73-221 (0.33)                18-57 (0.32)
            B. Porter                 9-23 (0.39)                 3-13 (0.23)
            T. Taylor                 6-23 (0.26)                  6-9 (0.67)
         K. Marble II                16-41 (0.39)                 3-12 (0.25)
        G. Milton III                13-43 (0.30)                 6-16 (0.38)
            K. Foster                19-76 (0.25)                 2-10 (0.20)
            J. Turner                  0-0 (0.00)                  0-0 (0.00)
         H. Fornstrom                  2-2 (1.00)                  0-0 (0.00)
            T. Morman                  0-0 (0.00)                  0-0 (0.00)